Going Short on EUR/USD After Failing to Push Above Moving Averages
EUR/USD has crawled higher today but it has found great difficulties trying to break some moving averages.
EUR/USD turned bearish yesterday after trending higher for about a week. The decline was pretty big, more than 150 pips, which looks like a trend reversal. Although today, it has been retracing higher during the European session.
We weren’t sure whether this was just a bullish retrace of the bearish move we witnessed yesterday or if yesterday’s move was a retrace of last week’s bullish move, which would have meant that the crawl higher today was just EUR/USD resuming the uptrend from last week.
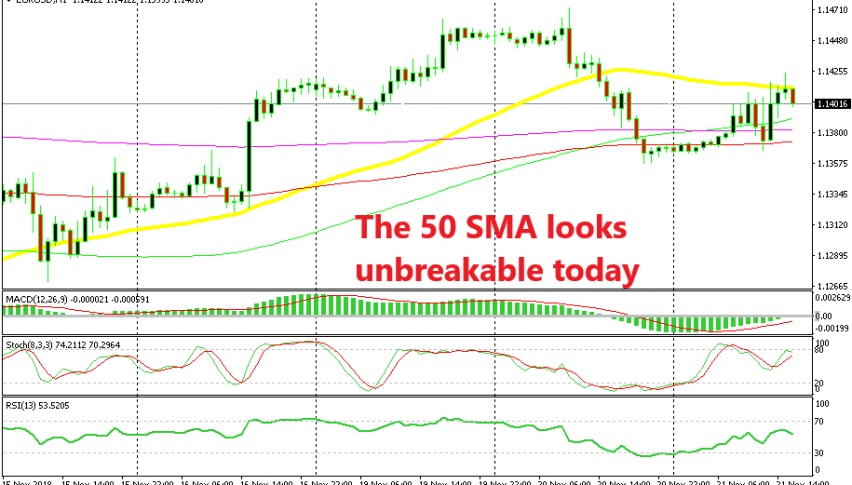
But, the price action during the European session showed us that EUR/USD couldn’t climb higher, let alone resume last week’s uptrend and make new highs above 1.15. The highs today have been somewhere in the region of 1.1410-20 and the buyers have tried to push above it for several hours, but without much success.
Besides that, the 50 SMA (yellow) has been providing solid resistance up there on the H1 chart. The previous candlestick also closed as a doji which is a reversing signal after a bullish move, such as the one we saw during the European session.
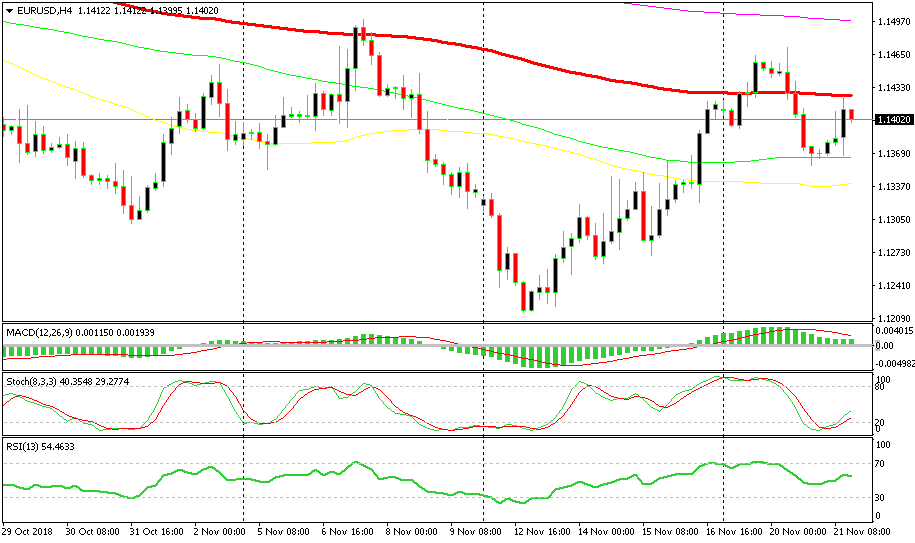
The 100 SMA is standing strong today
Another reason for our selling EUR/USD is the 100 SMA (red) on the H4 chart. If you switch to the H4 EUR/USD chart, you can see that this moving average has provided resistance two weeks ago and it is providing resistance today again. This makes several technical indicators pointing to a bearish reversal soon, hence our sell signal in this pair.
- Check out our free forex signals
- Follow the top economic events on FX Leaders economic calendar
- Trade better, discover more Forex Trading Strategies
- Open a FREE Trading Account
- Read our latest reviews on: Avatrade, Exness, HFM and XM
Related Articles


Sidebar rates
Related Posts
