Moving Averages Turn From Resistance to Support for Gold
Moving averages were providing resistance for Gold as it reversed higher. But now, they have turned into support on the H1 chart.
Gold turned pretty bearish during the second week this month, after the US midterm elections were over and the FOMC statement was released. But, it made another reversal, this time bullish at the zone surrounding $1,200 after it formed a doji candlestick on the daily chart.
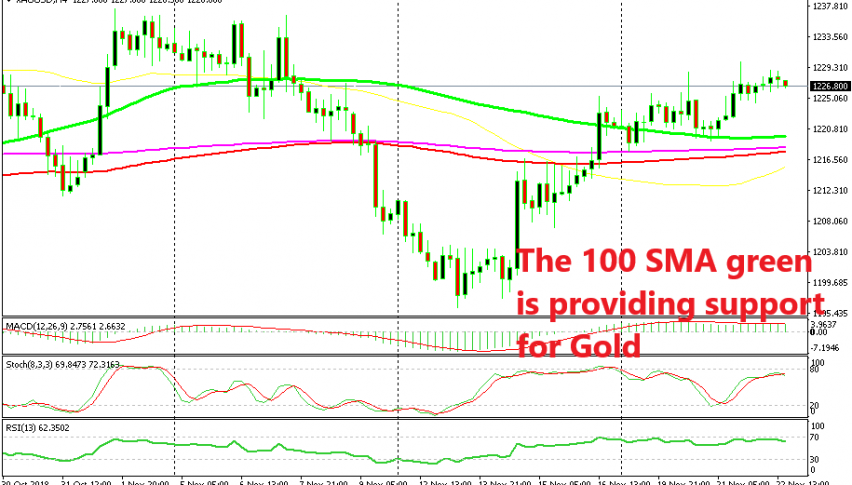
The buyers found some solid resistance at the 100 smooth MA (red) for a few sessions on the H4 chart, as you can see from the image above. Eventually, that moving average was broken and Gold buyers managed to push the price above the other two moving average that stands above the 100 smooth MA.
They haven’t been able to push much higher though, but the sellers can’t get their way either because the 100 simple MA (green) has provided support many times. It was the 200 SMA (purple) which provided support on the first attempt to push lower at the beginning of this week, now it is the 100 simple MA which has turned into solid support.
That moving average stands at around $1,220 at the moment, so that area looks like a good place to go long. If Gold tries the downside again soon and the 100 SMA holds, then we might be persuaded to open a buy forex signals at that level.
- Check out our free forex signals
- Follow the top economic events on FX Leaders economic calendar
- Trade better, discover more Forex Trading Strategies
- Open a FREE Trading Account


