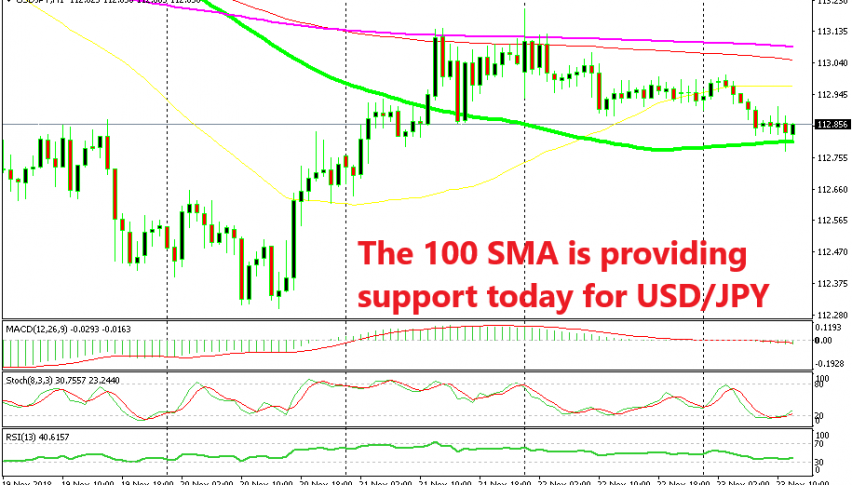
A Quick Buy Trade in USD/JPY After the 100 SMA Holds
USD/JPY has retraced lower after failing to break above 2 MAs, but it is now finding support at the 100 SMA and it has formed a bullish...

As we mentioned in one of the forex updates yesterday, USD/JPY was having great difficulties trying to break above the 100 SMA (red) and 200 SMA (purple) on the H1 chart. The price was banging against those two moving averages for a couple of sessions and eventually returned lower after it failed to break them.
Although, now the bearish move seems to be over on the H1 chart. The stochastic indicator is oversold and it is now turning higher. Besides that, the 100 simple MA (green) provided solid support in the last couple of hours. We can say that the previous candlestick looks like a hammer which is a reversing signal, but it’s a bearish hammer, so it isn’t valid for a bullish reversal.

The doji candlestick point to a bullish reversal
But if we switch to the H4 chart, we can see that the price has formed a doji in the previous H4 candlestick. Also, the stochastic indicator is oversold on this time-frame as well, which means that the bearish retrace is complete on this chart.
So, according to these two charts, USD/JPY should start moving higher now and that’s the reason we went long on USD/JPY. Let’s hope we don’t hear any negative comments soon which would turn the market sentiment negative and sink USD/JPY.
- Check out our free forex signals
- Follow the top economic events on FX Leaders economic calendar
- Trade better, discover more Forex Trading Strategies
- Open a FREE Trading Account


