EUR/GBP Moves Higher After Finding Support at the 200 SMA
EUR/GBP has been trading sideways for a few days, finding support at the 200 SMA. But today it made a bullish move which could stretch...

EUR/GBP made a big bullish move two weeks ago as the GBP dived on another negative Brexit news. Although last week, this pair retraced down on more Brexit news. We have mentioned many times that trading GBP pairs is a bit of a gamble right now, you could end up with a nice big profit in no time if things go your way, but you can get a negative comment and everything crashes down.
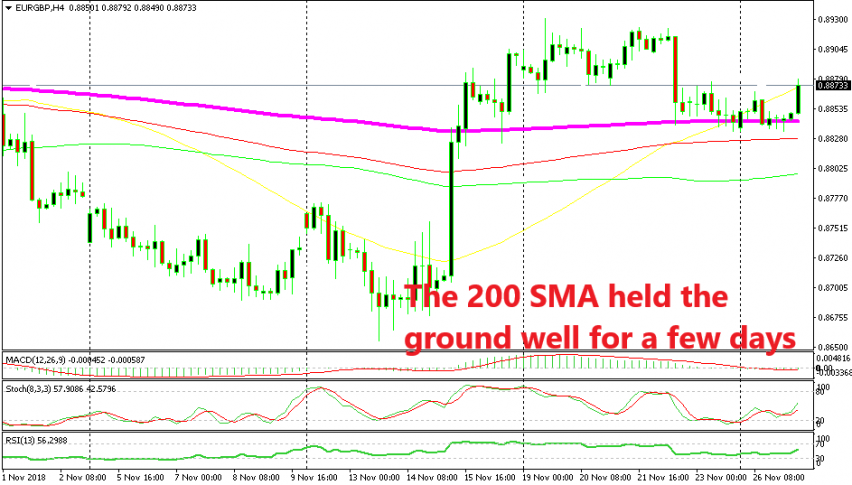
Anyhow, this forex pair has consolidated since late last week and it has traded in a tight range for a few trading days. The bottom of the range was defined by the 200 SMA (purple) on the H4 chart. This moving average has been providing support for this pair for several days, so it has been a strong support indicator.
As you can see from the H4 chart at the top, yesterday, the price formed a couple of dojis right at the 200 SMA before making the bullish move this morning. I was looking at this chart yesterday but refrained from taking a trade on the long side because of all the Brexit news we are getting these days.
 The 50 and 100 SMAs are providing support on the daily chart
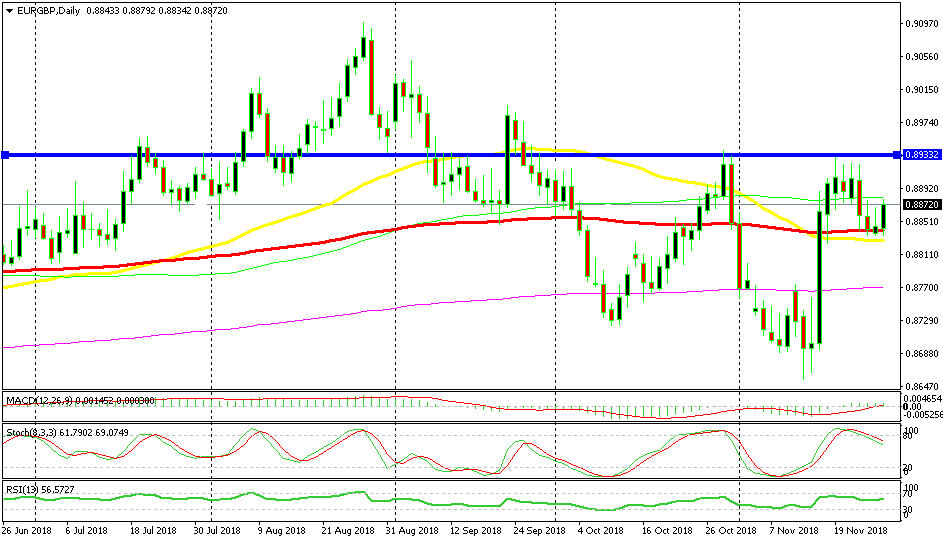
If you switch to the daily time-frame, you can see that it was the 50 SMA (yellow) and the 100 SMA (red) which were providing support here. But now, EUR/GBP buyers are facing the 100 simple MA (green) above. If they manage to push above this moving average, then the next target is the high of the last two months at 0.8930.
- Check out our free forex signals
- Follow the top economic events on FX Leaders economic calendar
- Trade better, discover more Forex Trading Strategies
- Open a FREE Trading Account
 The 50 and 100 SMAs are providing support on the daily chart

