Gold Forming a Bearish Reversal Chart Setup
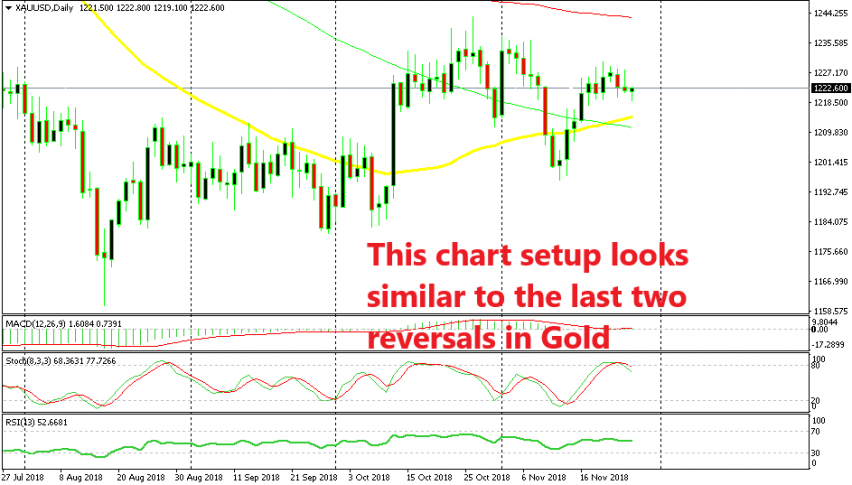
GOLD declined lower at the beginning of this month after the US midterm elections and the FED meeting were over. The USD got a relief after those two events and Gold started sliding lower, losing around $35 on the way down. But, it made a bullish reversal after it formed a doji candlestick at the $1,200 level.
So, Gold climbed around $25 after that doji in the following week, but last week, the price action was pretty slow. Gold traded mostly sideways with most of the candlesticks ending up as bearish. The price action shows that the buyers are losing steam and the chart setup looks like the beginning of a bearish reversal.
This chart setup looks like the setups in October or early this month when Gold turned lower and lost considerable value. The stochastic indicator is also overbought and it is turning lower as well now, so the bearish setup is taking form.

The moving averages are still holding in Gold
Although, if we switch to the H4 chart, we see that a number of moving averages are standing just below the price. The 50 SMA (yellow) and the 100 simple MA (green) are now providing support for Gold, but it is not bouncing higher off them.
If Gold buyers can’t push higher soon and reverse the price on the H4 chart, then the only way is down. If the moving averages break, then we might be persuaded to go short with the break since it would open the door for $1,200 as the first target. In that case, we would place the stop above these moving averages.


