NZD/USD Forms a Bearish Reversal Setup After a Double/Triple Top
NZD/USD has formed a double top chart pattern after surging 100 pips higher yesterday.
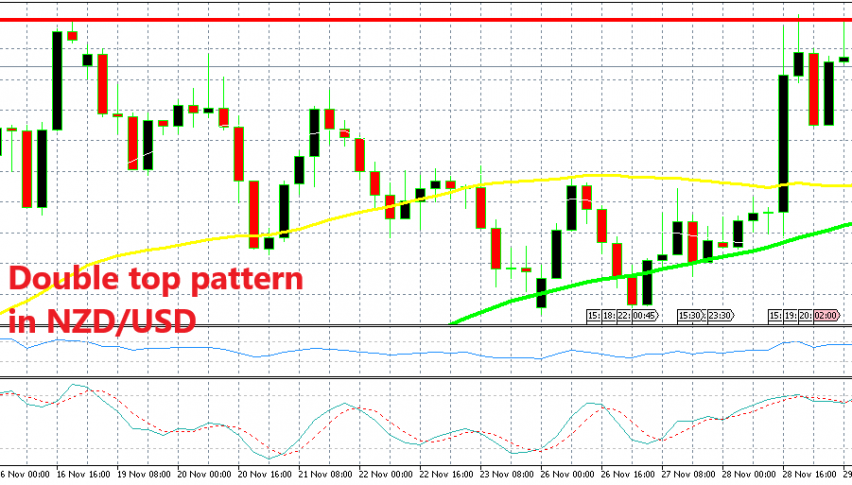
NZD/USD surged 100 pips higher yesterday on Powell’s comments that the interest rates are “just below neutral” which suggest that the FED might stop hiking them soon, or that’s what the markets realized. But now forex traders are having second thoughts; perhaps that’s not what Powell meant.
So, the climb in NZD/USD and in other pairs has stopped and it looks now like this forex pair might reverse back down soon. The climb stopped at 0.6880s last evening and retraced lower before the buyers had another go at this resistance level.
As you can see from the H4 chart above, this level provided resistance about two weeks ago, so it was a previous resistance. Today, the buyers tied to break this resistance level once again but failed to break above it and NZD/USD has formed a bearish reversing chart pattern now.
The 0.6880s area has provided resistance three times, but the most recent pattern is the double top pattern of the last two days. According to this pattern, when the price breaks the neckline, which is yesterday’s low at 0.6830s, it should fall by the same amount of pips as the distance from the neckline to the top, which is 50 pips.
So, NZD/USD should fall to 0.6780s, which means a 100 pip decline from the top, 50 pips from the top to the neckline and 50 pips from the neckline down. The previous candlestick closed as an upside-down pin below the resistance, which is a bearish reversing signal.
Besides, the stochastic indicator is overbought, so the reverse down is overdue. I would like to have gone short near the top with a tight stop above 0.69, but even this is a good level to go short with a stop above the resistance and a take profit target above 0.6780s. The risk/reward ratio is still attractive.
Then, there is another chart pattern if we consider the highs of the last two days as just one top and the high from mid-November as another top. In that case, NZD/USD should fall around 250 pips; but one step at a time – let’s see if this pair breaks the neckline first and reaches the first target at 0.6780s.
- Check out our free forex signals
- Follow the top economic events on FX Leaders economic calendar
- Trade better, discover more Forex Trading Strategies
- Open a FREE Trading Account


