The 100 SMA Providing Both Support and Resistance for EUR/USD
EUR/USD is finding support at the 100 SMA but it is also finding resistance at the same MA, Contradictory? Not really.
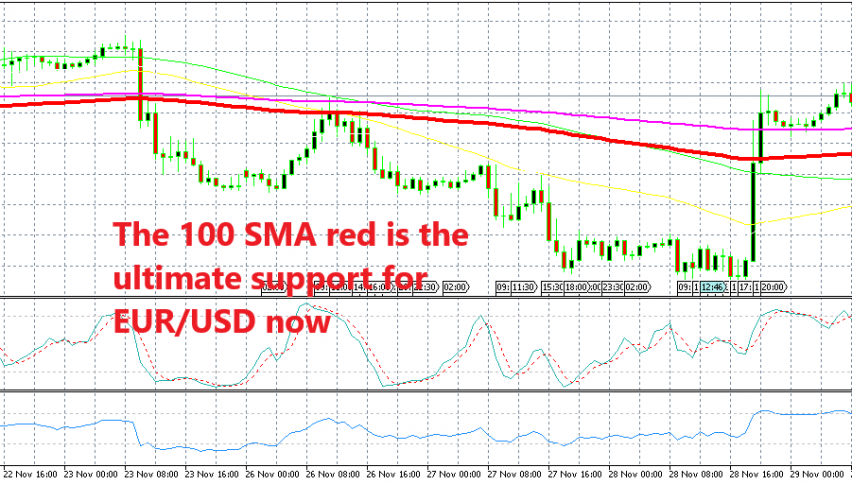
The headline of this forex update seems contradictory but it isn’t. As you can see from the chart above, EUR/USD has been finding solid support at the 100 simple MA (red) today. This forex pair surged around 130 pips higher yesterday after Powell’s comments, breaking all moving averages.
The sellers tried to reverse the price lower after that move and again today, but the 200 SMA (purple) has done a good hob providing support and the 100 SMA was the ultimate support on the 50 pip move lower today. So the 100 SMA has turned into the ultimate level to break for EUR/USD sellers if they want to resume the bearish trend of the last several days. That is the picture on the H1 chart.
The role of the 100 SMA reverses in the H4 chart
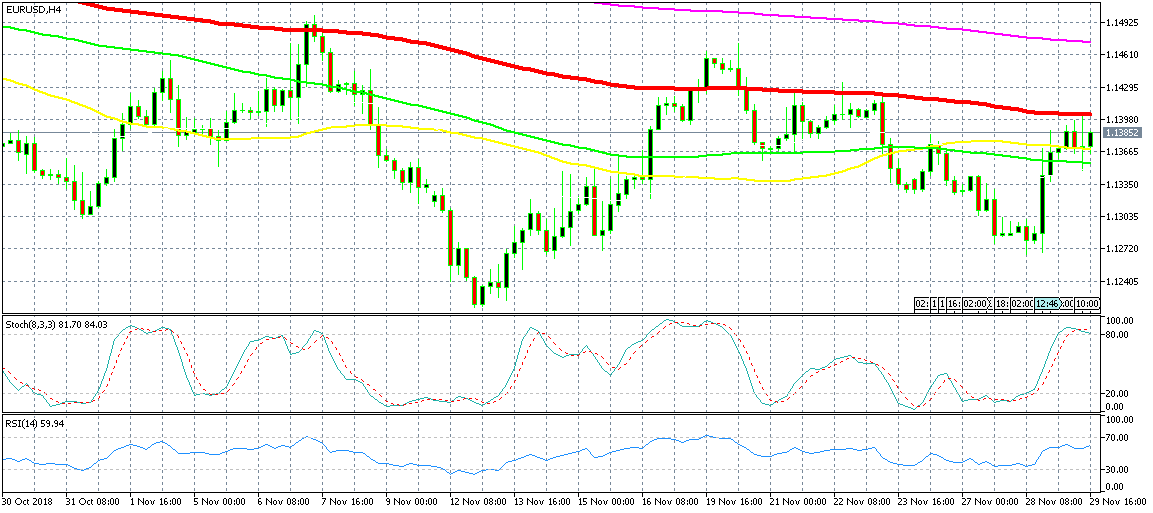
Now, if we switch to the H4 chart, we can see that the same moving average is standing on top of this move in this time-frame. The 100 SMA has been providing resistance to EUR/USD several times since the beginning of this month and it is doing the same now.
The stochastic indicator is also overbought on the H4 chart, so this might be a good chance to sell this pair actually. The retrace is complete on the H4 chart and the trend is still bearish, but the problem now is that the market is doubting whether the FED will continue to hike interest rates next year and in the years to come. Although, everything is still pointing down for this pair, both technically and fundamentally, so we might go short on EUR/USD to be honest.
- Check out our free forex signals
- Follow the top economic events on FX Leaders economic calendar
- Trade better, discover more Forex Trading Strategies
- Open a FREE Trading Account


