USD/CAD Following A Strict Uptrend Since October 1
USD/CAD looks to be trading sideways on small charts, but the H4 chart shows an uptrend which started in October.
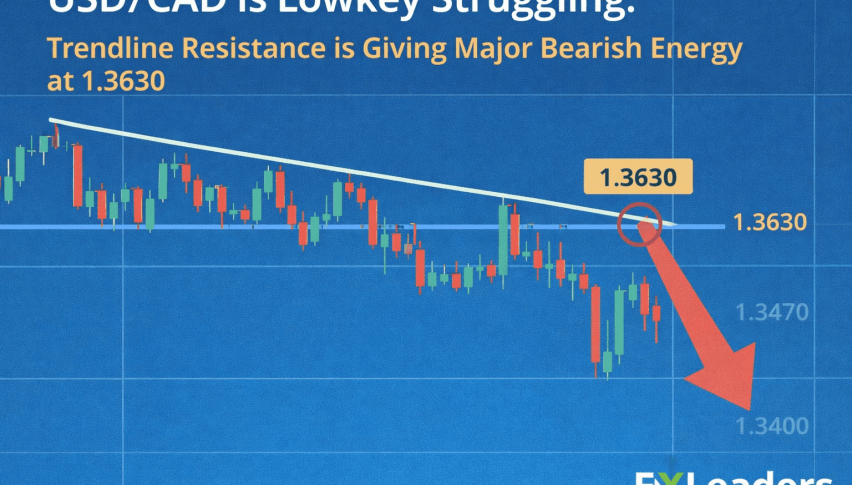
USD/CAD has seen some up-and-down price action in the last two days. Yesterday it fell around 70 pips after Powell’s comments but the fall has stopped and it is now trying to reverse back up. So, this sort of price action is a bit confusing. It looks more like a range trading if you look at the smaller time-frame charts such as the 15 minute, 30 minute and even the H1 chart.
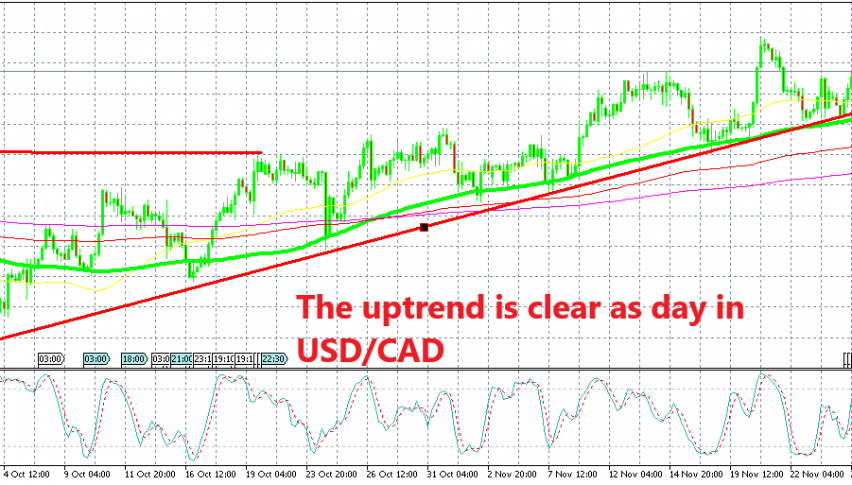
Although, if you look at the larger time-frame charts then you will see the bigger picture. Taking a look at the H4 chart above, we can clearly distinguish that USD/CAD is actually trading on a bullish trend. The bullish trend began on October 1.
You can see the red ascending trend-line connecting the lows on this pair. But, there is also the 100 SMA (green) which has been providing support during the bearish retraces lower. Moving averages are a bit more flexible than trend lines, so they tend to work better and the 100 SMA has worked really well as support.
This moving average stands at 1.32 more or less which is a big round level. But the price was not able to reach that low yesterday despite the weakness in the USD. We are seeing USD/CAD reverse higher right now so that moving average and the trend line look a bit far, but that’s one to keep in mind if you are trading the CAD. If we see a dip down there, then we will likely open a buy forex signal.
- Check out our free forex signals
- Follow the top economic events on FX Leaders economic calendar
- Trade better, discover more Forex Trading Strategies
- Open a FREE Trading Account
- Read our latest reviews on: Avatrade, Exness, HFM and XM
Related Articles


Sidebar rates
Related Posts
