EUR/USD Respects Moving Averages And Reverses
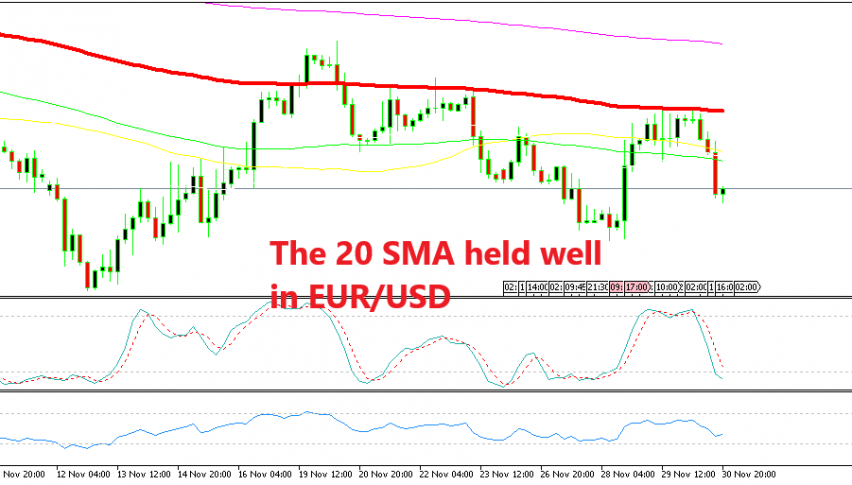
EUR/USD reversed higher on Wednesday on Powell's comments, but moving averages contained the upside this time.

EUR/USD made a bullish reversal on Wednesday from below 1.13 and climbed more than 120 pips on Powell’s comments that the FED interest rates might be “near neutral”. EUR/USD reached 1.14 yesterday but it traded sideways mostly for a few sessions as the G20 summit was approaching and no one knows how it might end up.
The buyers tried to break above the 100 SMA (red) on the H4 chart many times, but the 100 SMA held its ground well. After it made a two small dojis early this morning on the H4 chart, which are reversing signals, this forex pair turned lower.

The 20 SMA turned into resistance on this chart
If you switch to the daily EUR/USD chart, you can see that another moving average was providing resistance up there. The 20 SMA (grey) is standing right up there at at 1.1408 so it added extra strength to the resistance zone around 1.14. Now this pair has reversed back down and is 80 pips lower, so that is a lost opportunity for us, damn it.
- Check out our free forex signals
- Follow the top economic events on FX Leaders economic calendar
- Trade better, discover more Forex Trading Strategies
- Open a FREE Trading Account


