Bitcoin (BTC) Gaining Support – is it Reversal or Retracement?
The BTC/USD is consolidating in a descending triangle pattern which is supporting the market near $3,375 along with hurdle at $3,600. It's..

Bitcoin is down more than 80% from its all-time high. It has plunged since the beginning of this year, dragging most major cryptocurrencies down with it. I still remember the lead crypto pair was approaching its all-time high near $20,000 during this time last year.
BTC/USD – Descending Triangle Pattern
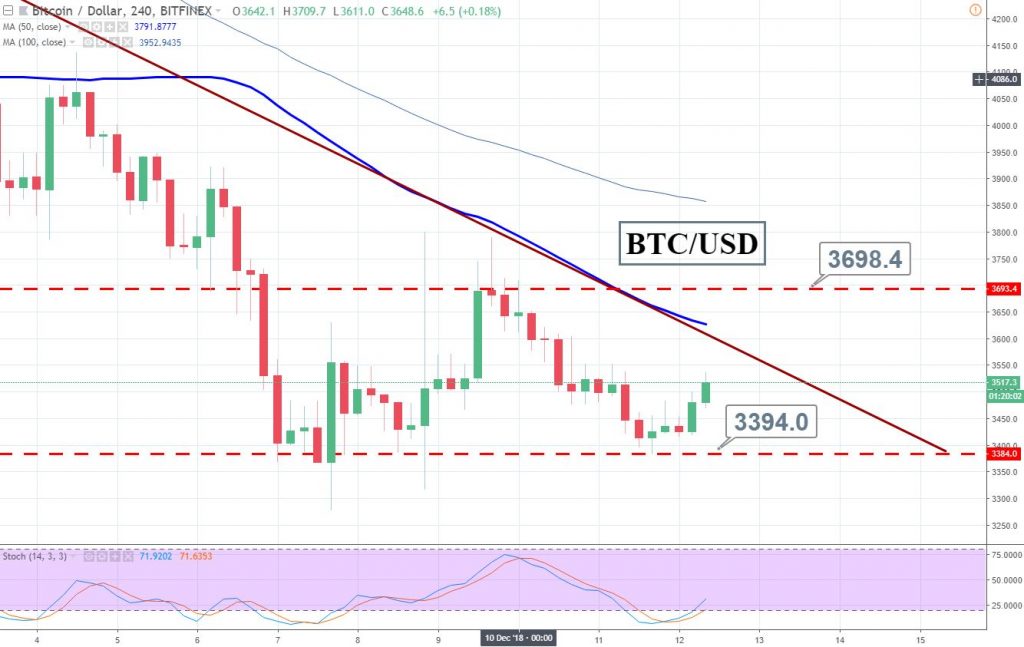
BTC/USD is consolidating in a descending triangle pattern which is supporting the market near $3,375 along with a hurdle at $3,600. It’s a good opportunity to trade the choppy market by selling on the upper boundary and buying above the lower one.
You can see on the 4-hour chart that the BTC is still holding above the multi-days support level of $3,375. For now, Bitcoin has tested this level for the third time, which makes it a triple bottom pattern.
The 50- periods EMA is working quite efficiently as the market failed to cross above it even after testing it multiple times. At the moment, the same EMA is providing resistance at $3600.
BTC/USD – Key Technical Levels
Support Resistance
3337.76 3521.83
3255.08 3623.22
3071.01 3807.29
Key Trading Level: 3439.15
BTC/USD – Trade Idea
Crypto junkies are suggested to keep a close eye on $3,375 as below this, BTC/USD can drop to $3,000. Whereas, BTC/USD can go after $3,700 if it manages to stay above $3,385.
Good luck!
- Check out our free forex signals
- Follow the top economic events on FX Leaders economic calendar
- Trade better, discover more Forex Trading Strategies
- Open a FREE Trading Account


