EUR/USD Heads Towards the 61.8 Fibonacci Level After Failing at the 100 SMA
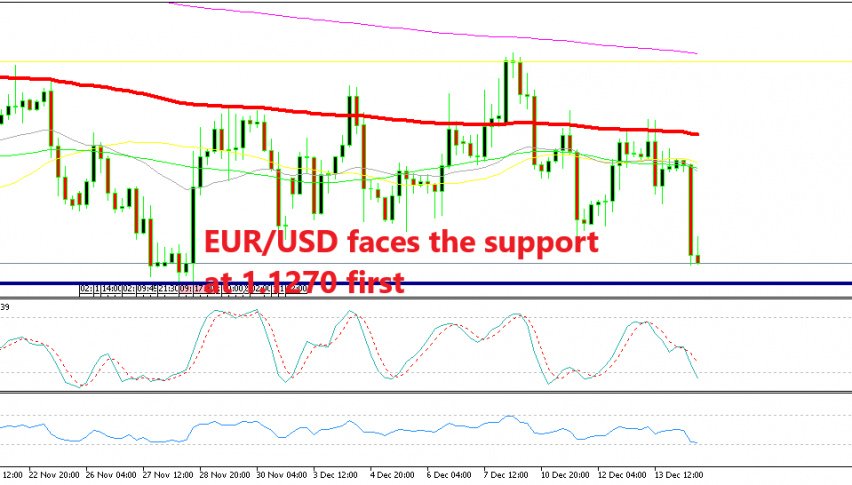
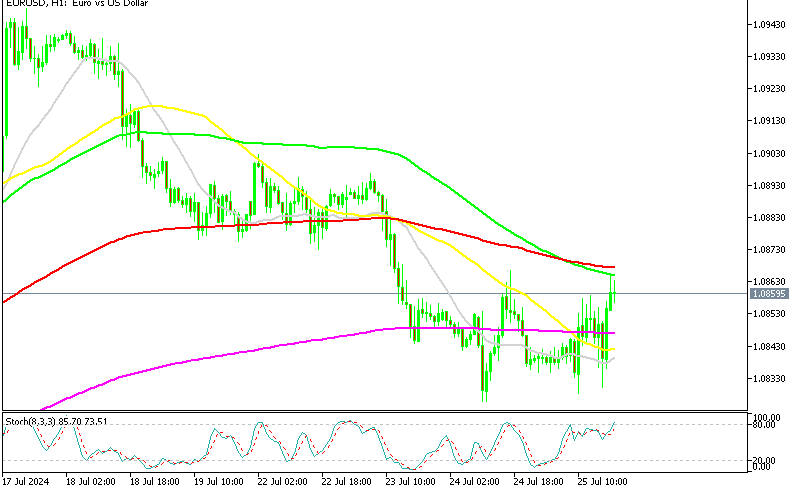
[[EUR/USD]] has been finding strong resistance at the 100 SMA (red) on the H4 chart despite piercing it a few times. In fact, EUR/USD broke this moving average early this month as this pair climbed higher to 1.1440. But, it reversed right at the 50% Fibonacci level after forming a doji candlestick which is a reversing signal.
After the bearish reversal, the 100 SMA resumed its job, providing resistance again for this pair. Yesterday, EUR/USD buyers had another attempt to break the 100 SMA, but they failed once again and EUR/USD turned bearish again after the European Central Bank let the market know that the risks regarding economic growth were tilted to the downside.
This morning, the economic data from the Eurozone was disappointing again. French manufacturing and services fell into contraction this month, while German and the Eurozone services and manufacturing are headed towards contraction.
Now, EUR/USD is headed towards this year’s low which comes at 1.1218 on my platform. I think that the the low will be broken this time, but the sellers have another big obstacle to take out. That’s the last Fibonacci retracement level. The 61.8% Fibo level comes at 1.1190, which means a 100 pip target for the sellers. Whether they will break that Fibo level remains to be seen, but first let’s see if they can reach that level.


