GBP/USD Turned Bearish After GDP Report But Remains Confined by Moving Averages
GBP/USD is trying to make up its mind as it bounces between moving averages this week.
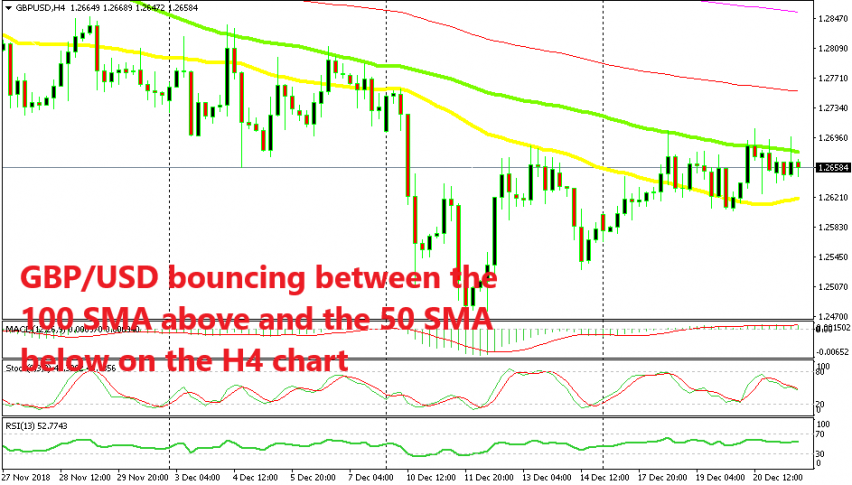
[[GBP/USD]] has turned bullish this week as the USD went through some rough times ahead and after the FED meeting on Wednesday. The market was expecting the FED to turn dovish and after a quick tremble up and down on Wednesday evening the consensus among forex traders is that the FED did sound sort of dovish but no too dovish. That has sent the USD lower this week and GBP/USD higher. But with Brexit coming no one wants to push things to far for GBP pairs.
So, this forex pair reached the 100 SMA (green) on the H4 chart on Monday and it has found some solid resistance at that moving average since then. It has bounced back down from it earlier this week but the other moving average which had been providing resistance previously has now turned into support.That moving average is the 50 SMA (yellow) as you can see from the H4 chart above.
Here we have the 200 SMA at the top and the 100 SMA at the bottom
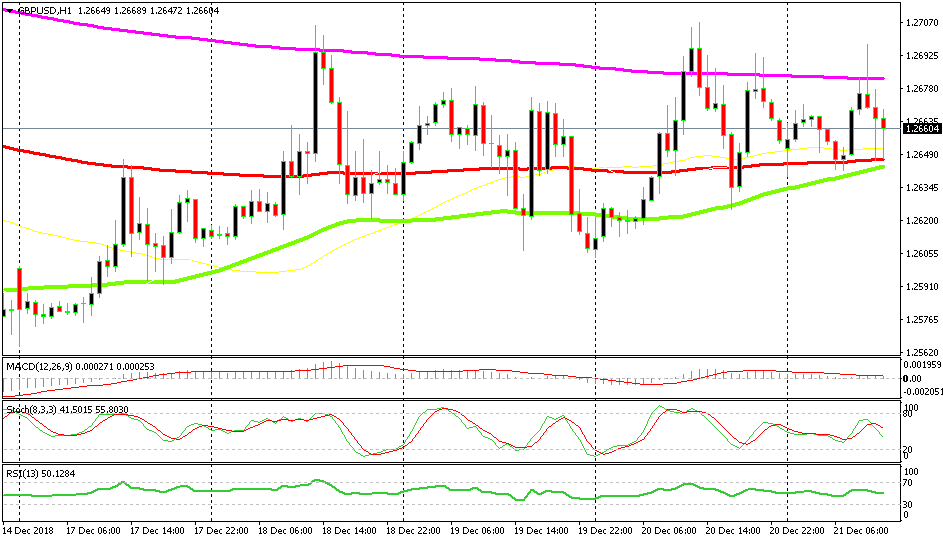
If we switch to the H1 chart, we see that the 200 SMA (purple) has been providing resistance at the top side for GBP/USD this week. The buyers couldn’t break it even though they have pierced it several times. The price pirrced the 200 SMA again this morning but GBP/USD reversed back down after the UK GDP report for Q3 was released.
The final reading for the Q3 GDP remained unchanged at 0.6% and the year-on-year number remained at 1.5% as well. Business investment was revised a bit higher to -1.1% from -1.2% previously for Q3 and for the year-up-to-date it was also revised higher to -1.8% from -1.9%, although the numbers are still negative which means that the investment has declined nearly 2% in Britain for this year up to the end of Q3.
So, GBP/USD has reversed down now but the moving averages on the H1 and H4 charts are holding the decline. But, this range between th moving averages is a good place to trade, sell at the top and buy at the bottom until one of them breaks at some point.
- Check out our free forex signals
- Follow the top economic events on FX Leaders economic calendar
- Trade better, discover more Forex Trading Strategies
- Open a FREE Trading Account


