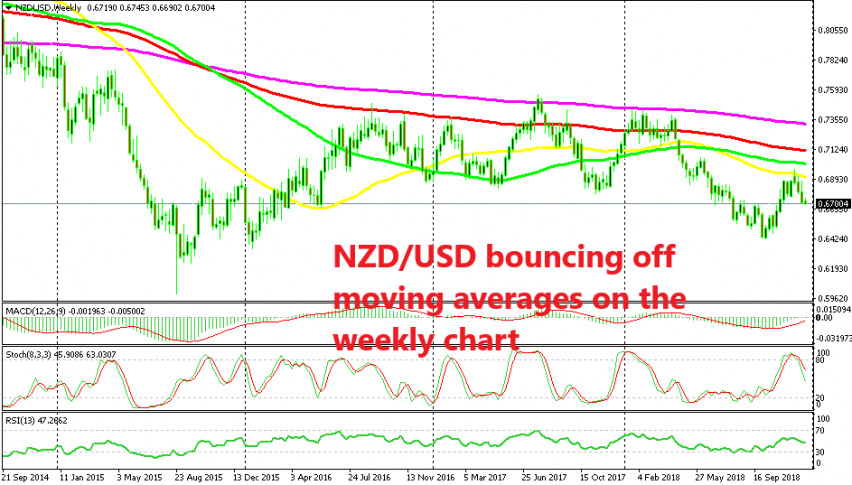
NZD/USD Respecting Moving Averages on the Weekly Chart
NZD/USD has been respecting moving averages and only three weeks ago the 50 SMA reversed this pair 250 pips lower.

NZD/USD traded on a slight bullish trend in 2016 and last year it traded mostly sideways, bouncing between 0.68 and 0.75. This year the trend has shifted to bearish. During this time, we have seen this forex pair interact pretty well with moving averages on the weekly time-frame chart.
First, the 50 SMA (yellow) provided some form of resistance in 2016, but it broke eventually and then it turned into support after that. The 100 simple MA (green) didn’t work well as resistance as the price moved higher, but it turned into solid support for this pair after it was broken and held the declines for nearly a year until summer last year.
On the top side, the 100 smooth MA (red) was providing resistance during that period as you can see from the weekly chart above. NZD/USD eventually broke the 100 smooth MA in summer last year but the 200 SMA (purple) took its place and worked as resistance from summer in 2017 until April this year.
The price turned bearish this year as the USD turned bullish and the moving averages were broken without much resistance. Now, we see that the 50 SMA has turned into resistance again. NZD/USD retraced higher during Autumn this year but the sellers gave up right at the 50 SMA.
The price formed an upside-down hammer candlestick at the 50 SMA which is a reversing signal. Too bad we didn’t see this chart formation earlier this month. We would be around 250 pips in profit now. But, we will keep the moving averages in mind if this pair decides to retrace higher again anytime soon.
- Check out our free forex signals
- Follow the top economic events on FX Leaders economic calendar
- Trade better, discover more Forex Trading Strategies
- Open a FREE Trading Account


