US Dollar Technical Forecast: Why Dollar Index Might Fall in Q1 2019
The dollar index closed sort of a hanging man candlestick for November, and the very next candle is bearish engulfing closing with full...
Federal Reserve ended the year 2018 with a dovish stance by lowering 2019 projections for growth and interest rates. At its December monetary policy meeting, the Federal Reserve’s Open Market Committee (FOMC) unanimously hiked the federal funds rate by 25 basis points, to 2.25%–2.50%.
Fed Outlook 2019
The median forecast of FOMC members for the Fed funds rate by the end of 2019 was reduced from 3.1% in September to 2.9% in December. This is symbolizing that FOMC members are now expecting on average two rate hikes next year instead of three. Consequently, the rate hike forecast for subsequent years is also lowered to reflect the fewer rate hikes in 2019.
Dollar Index – Technical Outlook
Taking a closer look at the monthly chart below, the dollar index closed sort of like a hanging man candlestick for November, and the very next candle is bearish engulfing closing with full bearish power at $96.02.
The leading indicators such as RSI and Stochastic have entered the overbought region.
The dollar index has completed 61.8% retracement below $98 on the monthly timeframe, which signifies that the bulls may be exhausted and sellers are looming around the corner.
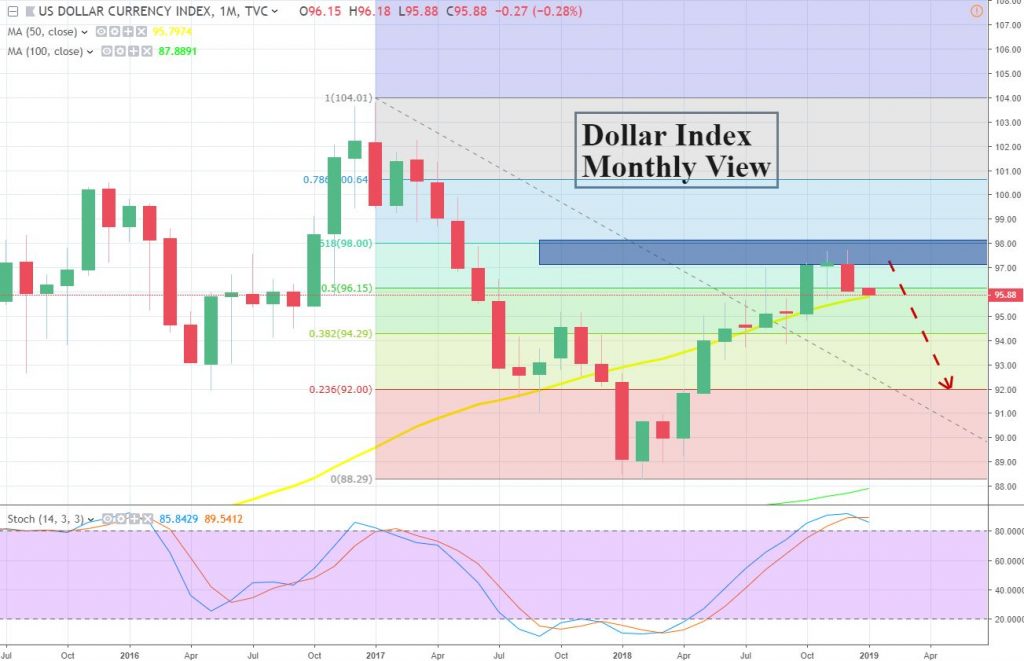
High Probability: The dollar index (DXY) is likely to continue trading bearish until $94.50 and the violation of this may lead it towards $92.
Low Probability: The violation of $98 can extend dollar’s bullish rally until $101 in Q1 2019.
- Check out our free forex signals
- Follow the top economic events on FX Leaders economic calendar
- Trade better, discover more Forex Trading Strategies
- Open a FREE Trading Account
- Read our latest reviews on: Avatrade, Exness, HFM and XM
Related Articles


Sidebar rates
Related Posts
