EUR/USD Turns Bearish at the 100 SMA on the Daily Chart
EUR/USD turned bearish yesterday and it is heading for 1.13 now. Can you guess the reasons why this pair reversed where it did?
Yesterday, EUR/USD made a U-turn which went to become a massive bearish turnaround. I mentioned in one of my forex updates yesterday that the 200 SMA (purple) on the H4 chart was going to be some sort of trouble for sellers because it had provided resistance before and then turned into support which lasted for about a week. But that moving average on the H4 chart did’t last long.
This pair was trading at 1.1420s, but that moving average got broken pretty swiftly and EUR/USD fell around 100 pips from there. But, the real reasons for the reversal were two: first, the resistance zone around the 1.15 level and two, the 100 SMA the daily chart.
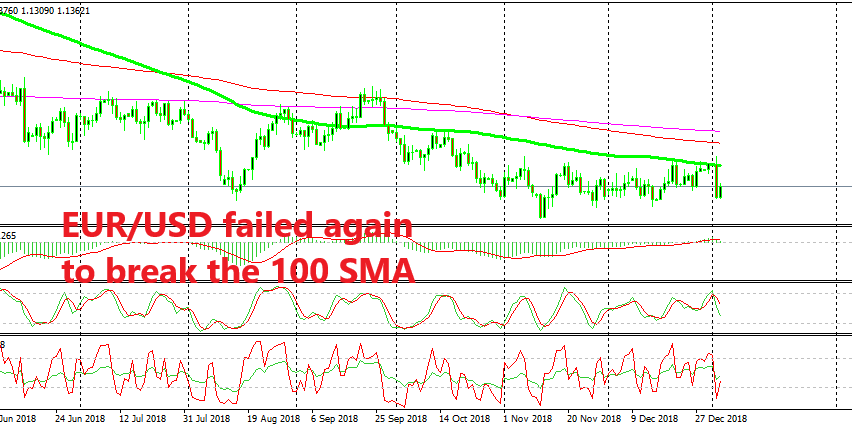
The 1.15 level has provided resistance many times before in the last two months – previously it used to be resistance. The 100 SMA (green) has provided resistance as well in the last two weeks and again in October. It got pierced during the last push from the buyers yesterday in the Asian session but the price returned below it, so it didn’t count as a break.
The price headed towards 1.13 but pulled back at 1.1325. So, we are eyeing this level again now. If it breaks, then EUR/USD will head for 1.13 next. Whether that support level will hold or get broken this time is another question, but let’s just take one step at a time. Let’s see if 1.13 breaks first.
- Check out our free forex signals
- Follow the top economic events on FX Leaders economic calendar
- Trade better, discover more Forex Trading Strategies
- Open a FREE Trading Account


