Gold at the Big Level and the Big MA
Gold has surged in the last two months but is facing two major technical indicators at the $1,300 level now.
GOLD has made a nice turnaround late this year, particularly since November as the market sentiment deteriorated. The low back in August came at $1,159 on my broker’s platform. Safe havens were declining during the first half of the year as the consensus among economists was that the global economy was expanding pretty quick, after last year’s surge in most developed economies.
Donald Trump was placing tariffs already but the market didn’t take him seriously. Then, as the major global economies started to decelerate, the demand for safe havens cam back. As a result, Gold made a bullish turnaround and now we find it near the big level at $1,300.
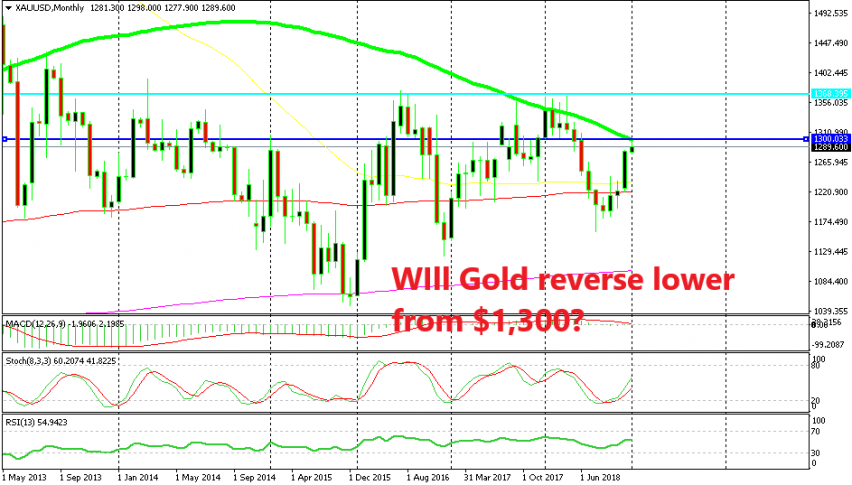
That is a big round level which has provided resistance before, so it is likely that Gold might reverse back down from here or at least make a decent retrace lower. Here, we can also find the 100 SMA on the monthly time-frame as you can see from the chart above.
This moving average provided resistance in 2017 and again early last year, despite being pierced a few times. But, none of the weekly candlesticks closed above it, so that doesn’t count as a break. Right now safe havens are in strong demand as we saw from the 5 cent dive in USD/JPY yesterday so it is a bit dangerous going against them right now but this is a good level for Gold to reverse, so we will see how it reacts around here in the next few session and if the price action justifies it, we might as well give the short side a go with a sell forex signal but we will have to nurse it carefully.
- Check out our free forex signals
- Follow the top economic events on FX Leaders economic calendar
- Trade better, discover more Forex Trading Strategies
- Open a FREE Trading Account


