Shorting NZD/USD at the 50 SMA
NZD/USD has been on a strong downtrend for about a month, but it retraced higher now, which is a good opportunity to go short.
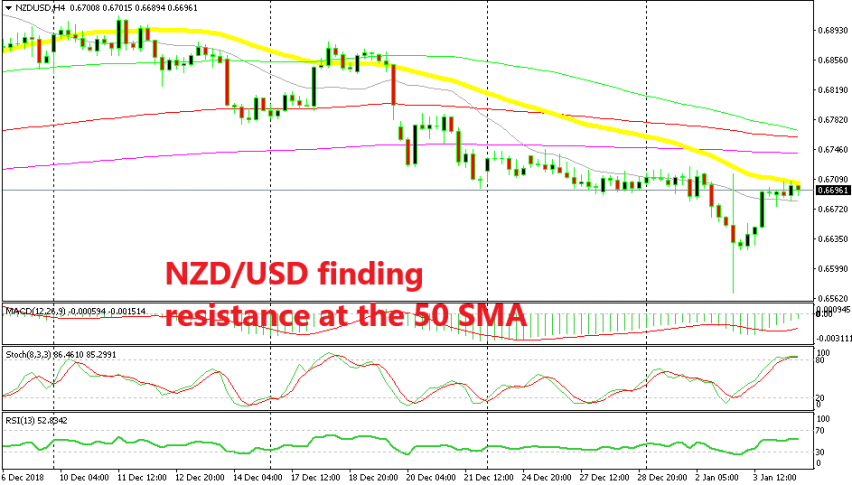
[[NZD/USD]] has been trading on a bearish trend in the last four weeks and in the last two weeks the downtrend has picked up pace. That can be spotted from the moving averages. The 20 SMA has been pushing NZD/USD lower in the last two weeks and we know that when smaller period moving averages come into play, it means that the trend is strong, be it bearish or bullish.
This pair made a 150 pip wobble yesterday during the flash crash, but it didn’t suffer as much as AUD/USD. Although, it has been retracing higher since then and the retrace finally seems complete now on the H4 chart timeframe.
The stochastic indicator is now overbought here and the 50 SMA (yellow) is providing support. Yes. the downtrend has slowed since yesterday and the 20 SMA has been broken now, but the bearish trend is still intact and the 50 SMA has taken its place now. So, we decided to go short from here since this chart setup looks pretty favorable for sellers.
- Check out our free forex signals
- Follow the top economic events on FX Leaders economic calendar
- Trade better, discover more Forex Trading Strategies
- Open a FREE Trading Account


