The 50 SMA Catching up With USD/JPY. Ready to Sell?
USD/JPY has been retracing higher for a few days, but the 50 SMA is catching up now and we might see a bearish reversal lower.
[[USD/JPY]] has turned pretty bearish since mid December. Last week it took a big dive on the first trading day of this year, losing nearly 5 cents in a few hours as news regarding Apple and the Chinese economy came out. The markets panicked a bit and the JPY got some heavy bids as a safe haven asset, along with GOLD.
Although, the sentiment has improved a little since then in financial markets and safe havens have retreated. Gold has retreated off the $1,300 level while USD/JPY has left the 105 level behind and is now flirting with the 109 level.
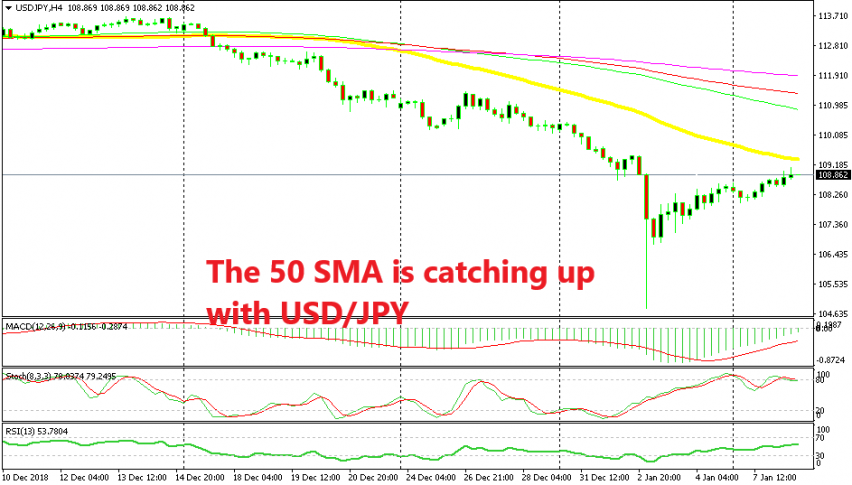
But now the price is overbought on the H4 chart in this forex pair. As you can see from the image above, USD/JPY has made quite a comeback and now the 50 SMA (yellow) is catching up with the price. This moving average stands at 109.30s which is around 50 pips above.
The previous H4 candlestick has closed as an upside-down hammer which is a reversing signal, particularly after a bullish retrace on a bearish trend. So, the picture seems good for a sell trade around here.
I would have liked the 50 SMA to be closer since the stop loss would be smaller, but let’s wait for some time and see if we can get a better selling price higher
- Check out our free forex signals
- Follow the top economic events on FX Leaders economic calendar
- Trade better, discover more Forex Trading Strategies
- Open a FREE Trading Account