A Bigger Look at USD/JPY – the Monthly Chart
USD/JPY has lost considerable grown in a month's time, but if we see the big picture things don't look too terrible.
The trend has turned really bearish for USD/JPY for nearly a month now. It started reversing around the middle of December and it has lost around 10 cents since then. The biggest punch came on January 2 this year as this pair lost nearly 5 cents after Apple announced disappointing earnings in China which they blamed on a weakening Chinese economy.
USD/JPY retraced most of the recent losses as the new year got underway in the last two weeks, but it resumed the downtrend again yesterday as the USD tumbled on dovish comments from FED members as well as from the FOMC minutes. So, it all seems like doomsday for this pair. But if we stand back and take a look at the bigger picture, then the situation doesn’t seem that bad.
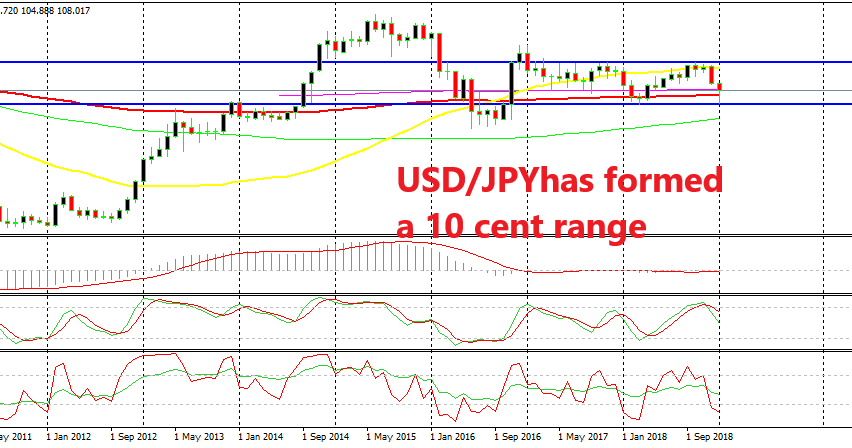
Looking at the monthly chart, we see that even with the lowest price which took place on January 2, USD/JPY would still be well within the range. The area below 105 has been support and then turned into resistance early last year. Now, it held the decline once again on the first business day of this year.
The range stretches for around 10 cents, from 104.50-105 on the bottom to 114.50-115 on the top side. The 50 SMA (yellow) also comes around that area now, so it is adding strength to the resistance zone. We see that in October and November, the price formed two doji candlesticks which are reversing signals. It then turned bearish in December and is still sliding lower.
Those who haven’t seen the monthly USD/JPY chart might complain about this big decline and they might as well have been caught on the wrong side, trying to catch a bottom. But, if we look at the bigger picture, we see that this is nothing extraordinary.
In fact, we might see 105 again pretty soon as worries about a global economic slowdown increase and demand for safe havens increase. So, if you are trying to trade this pair anytime soon, keep the monthly chart in mind. By the way, the 100 SMA (red) still remains in the way for sellers at 106.90.
- Check out our free forex signals
- Follow the top economic events on FX Leaders economic calendar
- Trade better, discover more Forex Trading Strategies
- Open a FREE Trading Account


