AUD/USD Forms a Bullish Chart Setup Above the 200 SMA
UAD/USD has retraced lower in the last few session, but the retrace seems complete now.
[[AUD/USD]] has turned really bullish in the last 7-8 trading days since it tumbled around 250 pips on January 3rd when the liquidity in the financial markets was really thin. But, the sentiment turned mildly positive in the past two weeks and that was enough for this pair to make a strong bullish turnaround.
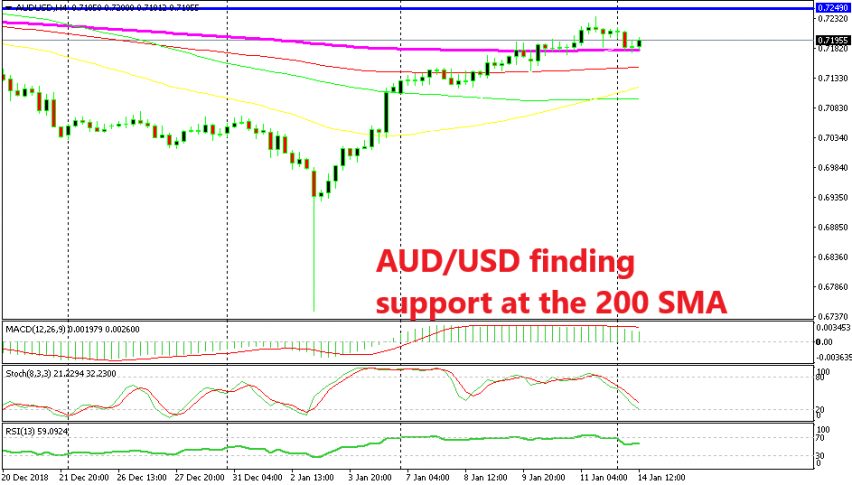
AUD/USD broke above all moving averages without much resistance. The price moved above the 200 SMA (purple) on the H4 chart last week and reached as high as 0.7235 on my platform. It retraced lower by the end of last week and during the Asian session today.
Although, the retrace lower seems complete now. The stochastic indicator is almost oversold on the H4 chart time-frame and the 200 SMA seems to have turned into support for this pair. Besides that, the previous H4 candlestick formed a doji which is a reversing signal.
The current candlestick confirms the bullish reversing chart setup. It already looks like a bullish candlestick and such a candlestick after a doji is a stronger signal for the reversal higher. Although, the sentiment is sort of negative today as safe havens find strong demand, that’s why I’m not going long on this pair just yet.
- Check out our free forex signals
- Follow the top economic events on FX Leaders economic calendar
- Trade better, discover more Forex Trading Strategies
- Open a FREE Trading Account
- Read our latest reviews on: Avatrade, Exness, HFM and XM
Related Articles


Sidebar rates
Related Posts
