The 20 SMA Is Defining the Trend for NZD/USD
NZD/USD retraced lower today, but the setup seems similar to the one we saw yesterday before this pair resumed the bullish trend.
Earlier today we went long on NZD/USD. This pair as well as AUD/USD have been on a solid uptrend in the last two weeks. We spotted a nice chart setup in the Aussie yesterday as it was finding support at the 200 SMA and forming a bullish reversal pattern, but we held back.
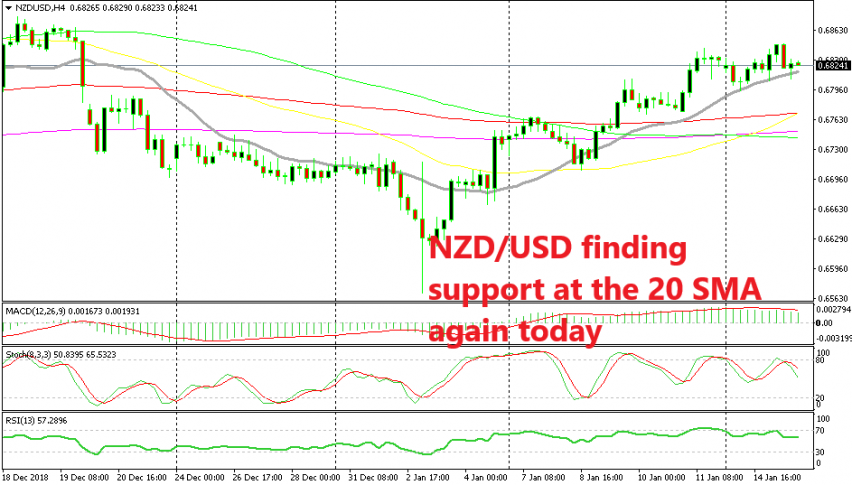
The chart setup is almost the same for that pair today, but we decided t go long on the Kiwi instead since the moving average providing support to this pair today is moving upwards, instead of being horizontal like the 200 SMA on AUD/USD. Here, we have the 20 SMA (grey) which is providing support.
As you can see from the H4 chart above, the 20 SMA kept the downtrend in place during mot of December. Now, the same moving average has turned into support and it is pushing the trend up in NZD/USD. Sellers tried to push below the 20 SMA earlier during the European session but they failed to break this moving average.
The stochastic indicator is not oversold yet on this time-frame chart, but the previous H4 candlestick formed a hammer. That is a reversing signal after the retrace lower. So, we have a really similar chart setup to the one we saw yesterday and we are already long on NZD/USD. Now, let’s hope that the uptrend resumes soon.
- Check out our free forex signals
- Follow the top economic events on FX Leaders economic calendar
- Trade better, discover more Forex Trading Strategies
- Open a FREE Trading Account