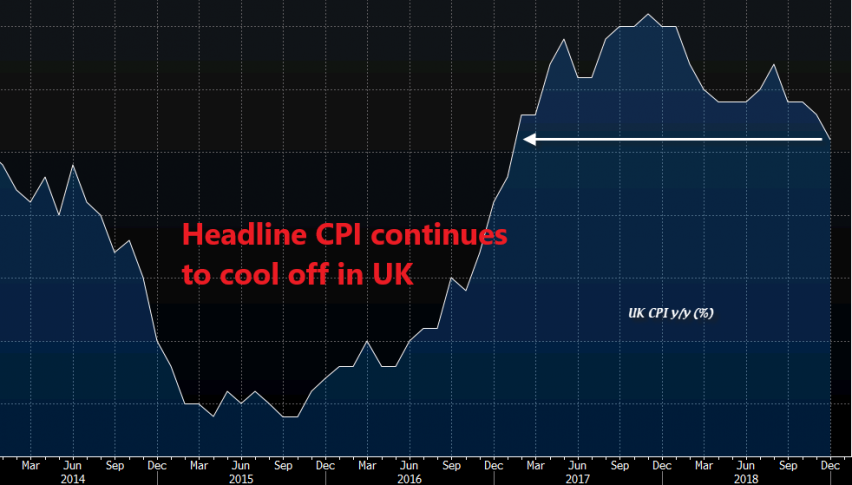
Mixed Inflation Figures From the UK
Inflation report was released a while ago in Britain, but the impact was minimal due to Brexit.
•
Last updated: Wednesday, January 16, 2019

The inflation report from the UK was released a while ago. The Bank of England Chairman was holding a speech meanwhile. Not much was expected from his speech today, being where we are with Brexit, and he did leave it all to Brexit. Let’s have a look at the inflation figures though:
| UK Data | Actual | Expected | Previous |
| CPI MoM | 0.2% | 0.2% | 0.2% |
| CPI YoY | 2.1% | 2.1% | 2.3% |
| CPI Core YoY | 1.9% | 1.8% | 1.8% |
| HPI YoY | 2.8% | 3.0% | 2.7% |
| RPI MoM | 0.4% | 0.5% | 0.4% |
| RPI YoY | 2.7% | 2.9% | 3.2% |
| PPI Input MoM | -1.0% | -1.5% | -2.3% |
| PPI Input YoY | 3.7% | 3.7% | 3.8% |
| PPI Output MoM | -0.3% | 0.1% | 0.2% |
| PPI Output YoY | 3.1% | 2.9% | 3.1% |
As you can see, PPI (producer price index) input and output declined and that is due to falling Oil prices. Crude Oil has made a pullback higher in the lat several weeks, but that will take some time to reflect in producer prices.
Headline inflation falls again to 2.1% from 2.3% previously, but core inflation ticked higher to 1.9% from 1.8% previously, beating expectations as well.
- Check out our free forex signals
- Follow the top economic events on FX Leaders economic calendar
- Trade better, discover more Forex Trading Strategies
- Open a FREE Trading Account
ABOUT THE AUTHOR
See More
Skerdian Meta
Lead Analyst
Skerdian Meta Lead Analyst.
Skerdian is a professional Forex trader and a market analyst. He has been actively engaged in market analysis for the past 11 years. Before becoming our head analyst, Skerdian served as a trader and market analyst in Saxo Bank's local branch, Aksioner. Skerdian specialized in experimenting with developing models and hands-on trading. Skerdian has a masters degree in finance and investment.


