Is the Retrace Over in GBP/USD?
GBP/USD has retraced 170 lower in the last few sessions, but that retrace might be over now.
GBP/USD turned the tail in the first trading day of this year after being on a downtrend for a couple of months and followed a bullish trend for the last three weeks. But, it failed to break the major level at 1.30 on Thursday evening as the climb stopped exactly there.
This pair slipped lower on Friday and has lost around 170 pips during the last few trading sessions in what seems to be a retrace of the bullish trend that we have seen so fr this year. The bullish trend is worth nearly 600 pips, so a 170 pip retrace lower is a decent and possibly complete pullback.
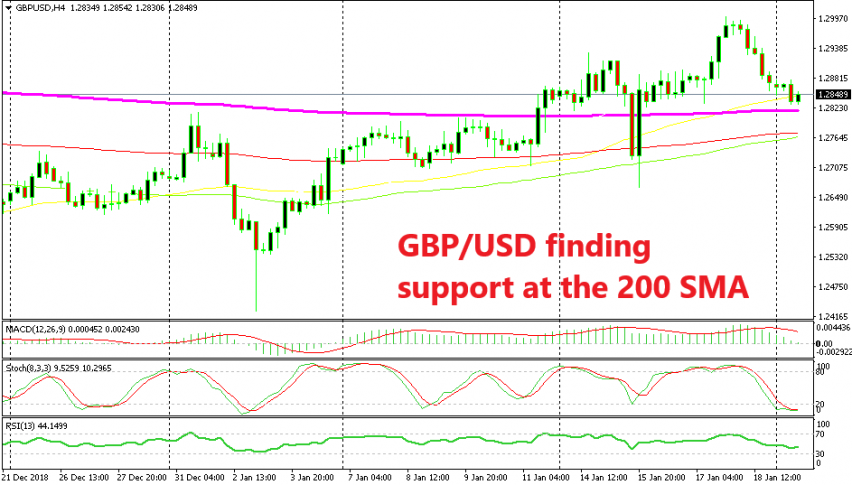
As you can see from the H4 chart above, the stochastic indicator is already oversold, which means that the retrace is indeed complete on this time-frame chart. You can see that GBP/USD has reversed back up when this indicator has reached or has gotten close to being oversold during this period.
So, this chart setup points to another bullish reversal soon, which might already be underway. The decline stopped above the 200 SMA (purple) on the H4 chart. This moving average has provided resistance a few times in the last two weeks, so now it seems like the 200 SMA has turned into resistance, which is normal for these sort of indicators.
I also think that the worst is over for Brexit, so it makes sense fundamentally as well as technically to go long from here. Although I would like another confirmation of a bullish reverse, such as a doji or pin candlestick, so I’m waiting for that now.
- Check out our free forex signals
- Follow the top economic events on FX Leaders economic calendar
- Trade better, discover more Forex Trading Strategies
- Open a FREE Trading Account


