Gold Forming a Bearish Reversing Pattern on the Weekly Chart
Gold has been bullish for a few months, but it has formed a bearish reversing chart setup on the weekly time-frame now.
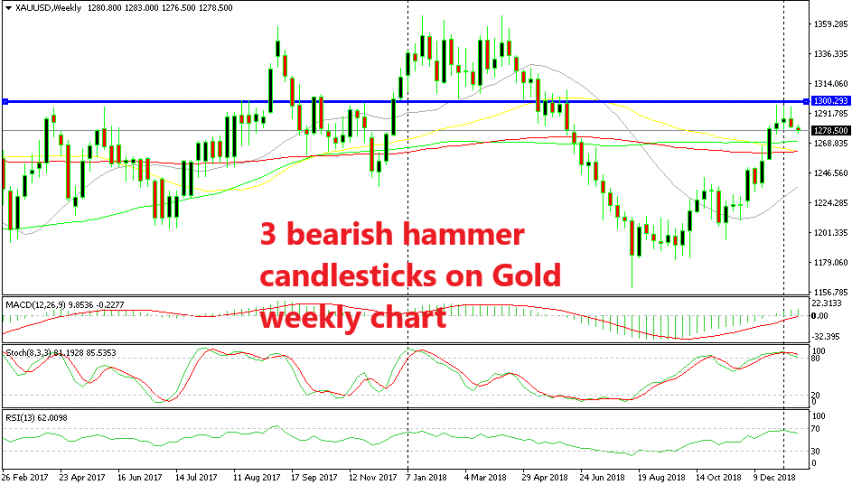
GOLD turned bullish at the end of last summer, as I mentioned in one of my gold updates yesterday. Although, it failed to break above the major resistance zone which surrounds the big round level at $1,300. So, we can conclude that this was just a retrace of the bigger bearish trend that started earlier last year.
That becomes even more clear when we see the bigger picture on the weekly chat. Gold is severely overbought on this time-frame, as the stochastic indicator shows. The stochastic is turning lower now, so the bullish move might be over already.
The chart setup on the weekly time-frame surely points to a bearish reversal. The candlestick from three weeks ago formed an upside-down hammer, which is a reversing signal after the bullish retrace higher. The following week, we saw a doji which again points down.
Last week, the price formed another bigger upside-down hammer which closed pretty bearish as well. This is a stronger bearish reversal signal. Gold has broken above all the moving averages on the weekly chart and they will probably be an obstacle for sellers on the way down. But the candlestick setup does point down, so we might see Gold be pretty bearish in the months to come.
- Check out our free forex signals
- Follow the top economic events on FX Leaders economic calendar
- Trade better, discover more Forex Trading Strategies
- Open a FREE Trading Account