NZD/USD Forming a Bullish Reversing Setup Above the 200 SMA
NZD/USD has been retracing lower in the last 2 days, but the trend is still bullish this week and the pullback is complete now.
Yesterday we decided to go long on NZD/USD as this pair was retracing lower after climbing 100 pips higher in the previous day. If you remember, on Wednesday during the Asian session the CPI (consumer price index), which is the main inflation report, remained unchanged for the year, both the headline and the core numbers. Meanwhile, inflation for Q4 of last year ticked one point higher with expectations being for a 0.0% reading.
That was a relief for NZD buyers it appears and this pair climbed 100 pips higher. Yesterday, NZD/USD retraced lower and was finding support at the 200 SMA (purple) on the H1 chart, so we decided to get in on this trend. The buyers attempted to push higher and resume the uptrend and our signal here was in 20 pip profit at some point. But they couldn’t push higher, so the retrace lower continued during the Asian session today.
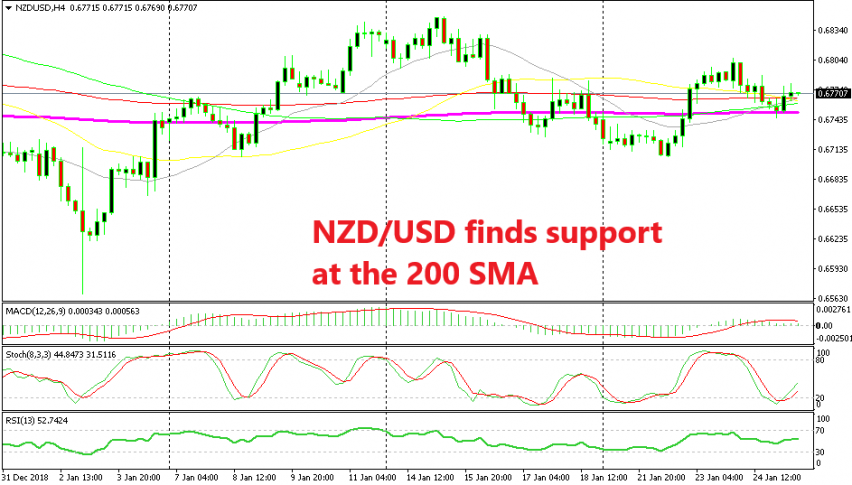
Although, we see now that Gold has found support at the same moving average, but this time on the H4 chart. The 200 SMA (purple) held the decline during the night and it seems that NZD/USD has formed a bullish reversing pattern now.
The stochastic indicator was oversold a while ago which means that the retrace lower is complete and now it is turning higher. The H4 candlestick formed a doji just above the 200 SMA which is a reversing signal and NZD/USD has already started the bullish reversal with two bullish candlesticks forming after that. Now, we have to wait until the uptrend of this week resumes and this pair makes new highs for the week.
- Check out our free forex signals
- Follow the top economic events on FX Leaders economic calendar
- Trade better, discover more Forex Trading Strategies
- Open a FREE Trading Account


