Shall We Buy the Bearish Retrace in Nikkei?
Nikkei has retraced lower today, but the trend is still bullish, so this looks like a good trade setup to go long.
Stock markets have formed a bottom after declining for most of the year in 2018. They turned massively bearish last year as the trade war between the US and China precipitated and the sentiment turned very bearish. But, they bottomed out at the very last week of last year and since then, we have seen them form a bullish trend.
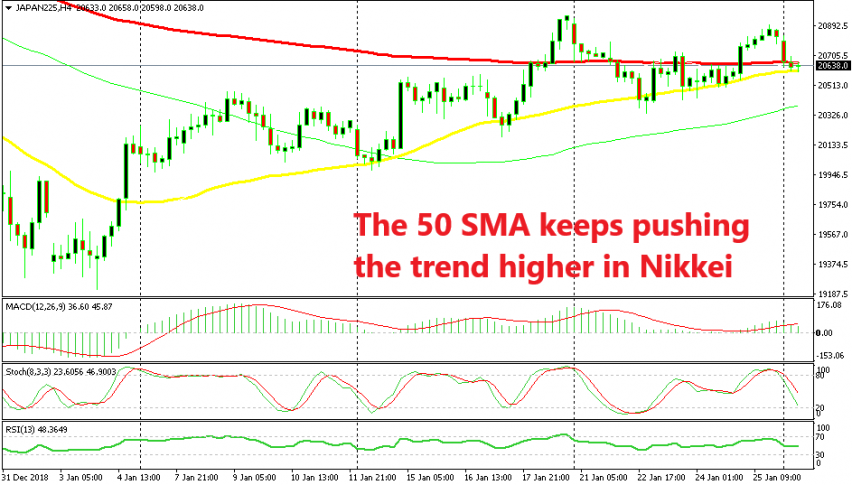
NIKKEI225 broke above the 50 SMA (yellow) on the H4 chart during the first week of this month and since then, this moving average has been providing solid support. it has held on all pullbacks lower and we have seen this index turn bullish at the 50 SMA.
The 100 SMA (red) was also broken last week. Today, we are seeing another retrace lower and the price is finding support at the 50 SMA once again. The chart setup also looks very similar to the other pullbacks in the last several weeks, all of which have been followed by a bullish reversal higher.
The 50 SMA is still holding yet again and the stochastic indicator is almost oversold, which means that the bearish retrace is almost complete. This looks like a good opportunity to go long, but safe havens remain bullish today which means that the market sentient is still negative. If we see Gold and the JPY turn lower, then that would be a sign that the sentiment is improving and we might open a buy signal in Nikkei. Until then, we will wait.
- Check out our free forex signals
- Follow the top economic events on FX Leaders economic calendar
- Trade better, discover more Forex Trading Strategies
- Open a FREE Trading Account