Shorting the Pullback on EUR/GBP at the 20 SMA
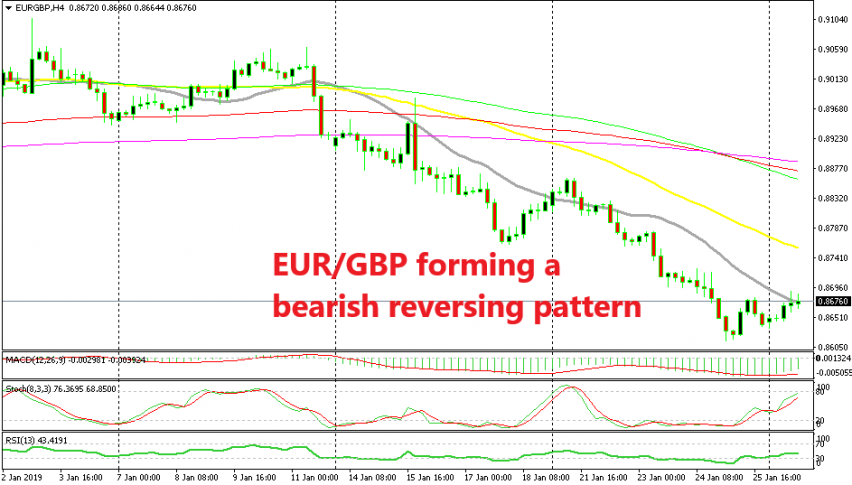
EUR/GBP has been on a strong bearish trend for 2 weeks but it's retracing higher today, which we see as a good chance for shorts.

EUR/GBP had been trading on a range for several weeks since early December, but in the last two weeks it finally decided to make a move and unsurprisingly the move came to the downside. The Euro is still trading sideways, while the GBP has entered a bullish trend climbing around 400 pips during the last two weeks as as odds of a no-deal Brexit diminish.
As a result, EUR/GBP has lost around 400 pips as well during this period. Although, the EUR/USD is continuing in the footsteps of last Friday, climbing higher today, while GBP/USD is retracing lower and it’s around 60 pips lower from the highs on Friday evening.
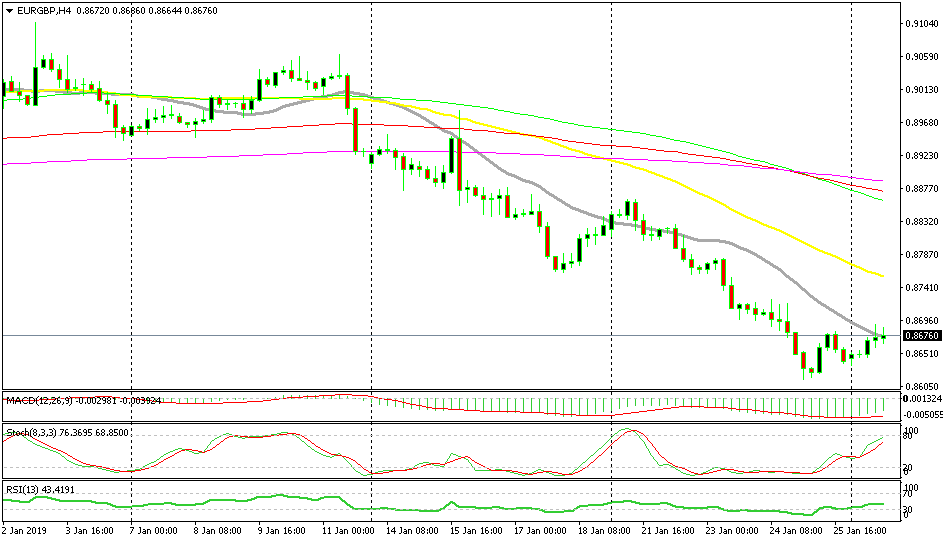
This has led to a bullish retrace in EUR/GBP today and is seems like this pair is finding resistance at the 20 SMA on the H4 chart. The 20 SMA has been pierced a couple of times but this moving average doesn’t work exactly to the pip as you can see from the history of the last two weeks.
So, we can’t consider this a proper break yet. The stochastic indicator is almost overbought now which means that the pullback higher is complete, while the previous H4 candlestick closed as a doji which is a reversing signal aftr the pullback higher. So, we decided to go short on this pair a while ago. Let’s see if the sellers will be able to resume the bearish trend now.

- Check out our free forex signals
- Follow the top economic events on FX Leaders economic calendar
- Trade better, discover more Forex Trading Strategies
- Open a FREE Trading Account


