Crude Oil Trades Sideways Between Moving Averages
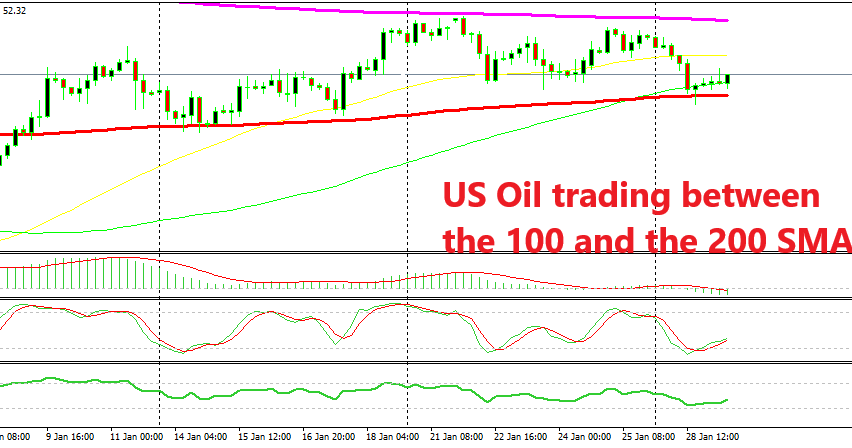
WTI crude Oil has been trading between a range between 2 moving averages for weeks.

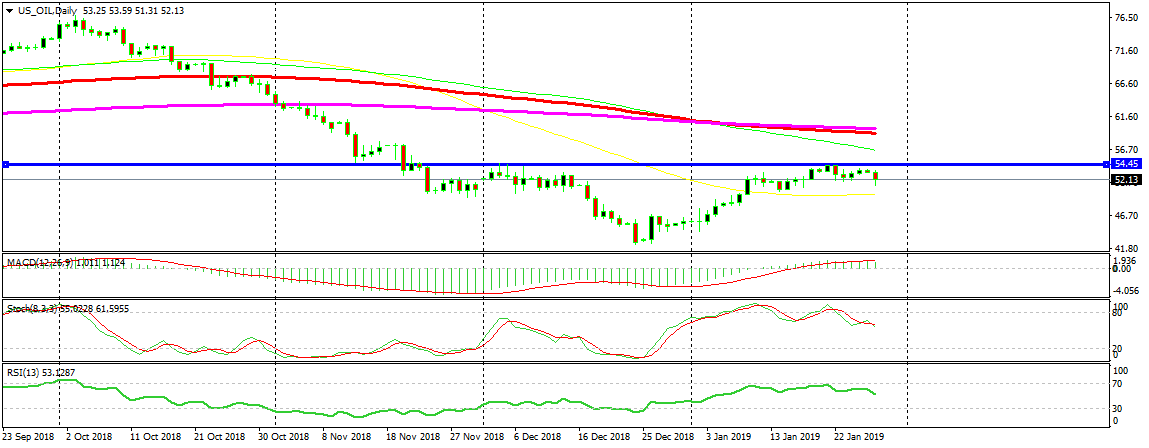
Crude Oil has reversed the major bearish trend that started in the beginning of October last year. The reverse started right after Christmas when the liquidity was very thin and WTI Crude Oil climbed around four and a half cents during that day and the climb has continued for a month.
WTI Crude Oil reached as high as $54.20 early last week, but since then it has been consolidating, trading inside a range. This sort of price action has been going on since then and US crude has been finding support at the 100 SMA (red) on the downside since then.
The 50 SMA (yellow) tried to take its place and it has been pushing Oil higher, resulting in higher lows during this time, but it was finally broken yesterday as the sentiment turned negative again and risk assets tumbled. So, the 100 SMA came back into play and provided support once again. The price formed a pin above it which is a reversing signal and a reverse followed.

The resistance at $54.50 level held once again
So, the range is in between the 100 SMA (red) at the bottom which comes at around $51.50 and the 200 SMA (purple) at the top, which comes at around $54.40-50. There’s a resistance area around the $54.50 level which has been providing resistance at the beginning of December when Oil was on the way down.
- Check out our free forex signals
- Follow the top economic events on FX Leaders economic calendar
- Trade better, discover more Forex Trading Strategies
- Open a FREE Trading Account


