Let’s See if Gold Buyers Overtake the 100 Monthly SMA this Time
Gold has broken above $1,300, but the monthly MA is still in play as resistance.

GOLD finally broke the big resistance level at $1,300 last Friday as it surged nearly 25 cents higher that day. No one really knew the real reason behind that move, but the USD got battered that day and Gold made the most of it.
Yesterday, the sellers tried that resistance level from the top side, which has now turned into support. The price slipped to $1,297.20, but then reversed up and Gold closed the day near the highs yesterday. Today, I see that Gold has been making new highs during the European session, so the uptrend has resumed and Gold buyers are not taking prisoners.
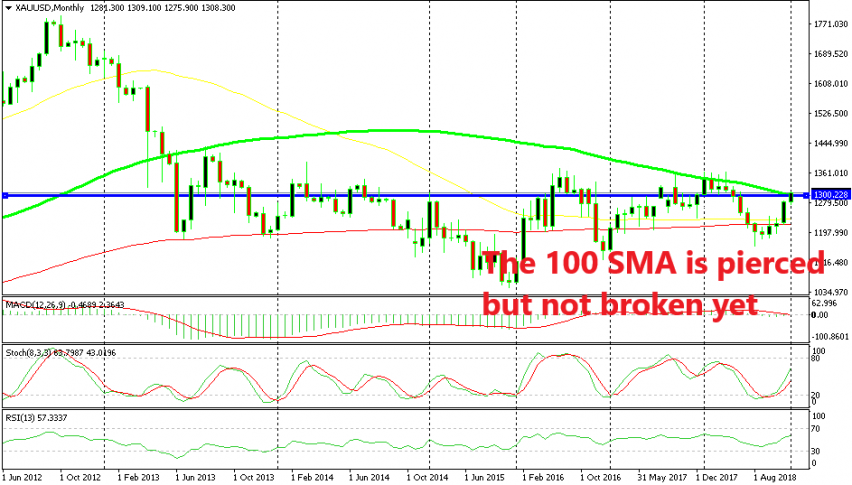
Although, if we see the monthly chart, we can spot the 100 SMA (green) which stands at $1,300 right now. This moving average has provided resistance back in 2013 and again in 2017 and 2018, which makes it the ultimate resistance indicator for buyers to overcome.
We are now around $8 above that moving average, but such large period indicators don’t work exactly to the pip. This moving average was pierced early last year when the price pushed $20-$25 above it several times but eventually turned back down below it and entered a bearish phase.
So, if Gold buyers don’t push too far above the 100 SMA, then there is a big chance that Gold might slip back below it and enter another bearish phase. The stochastic indicator will be overbought soon, but let’s see how the price will behave this week. If the price turns back below the 100 SMA, then it might be a really good opportunity to open a long term sell signal/trade, but not before we see Gold move below the 100 SMA again.
- Check out our free forex signals
- Follow the top economic events on FX Leaders economic calendar
- Trade better, discover more Forex Trading Strategies
- Open a FREE Trading Account


