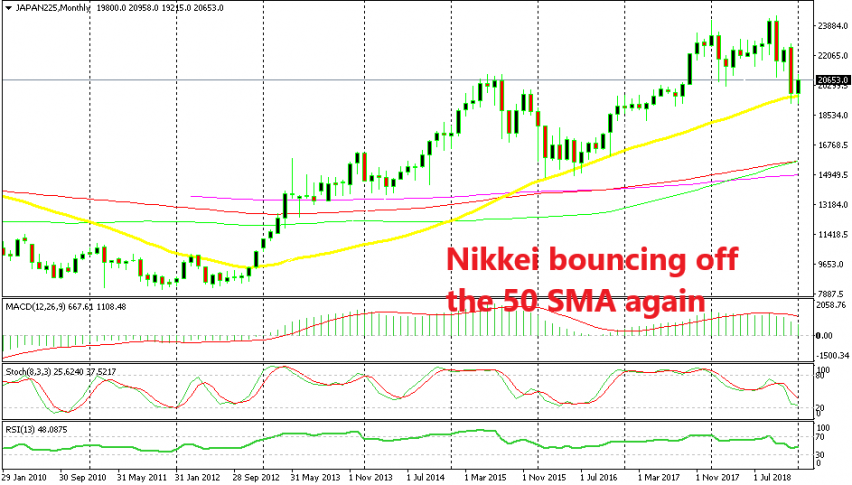
The 50 SMA Providing Both Support and Resistance for Nikkei, in Different Timeframes


The decline in stock markets last year was massive. Although, the decline was more severe on European stock markets, while the US and Asian stocks were late to catch up with it, until the beginning of October when Crude Oil also turned massively bearish.
But, the 50 SMA held its ground well on the monthly chart of NIKKEI225. The price pierced it in December and again this month, but there was no close below that moving average so the piercing doesn’t count as a break. This moving average has provided support and resistance during many years for Nikkei on this timeframe chart as shown above. We see that this index is bouncing off the 50 SMA once again now.

The same moving average is providing resistance on the daily chart
But if we switch to the daily timeframe, we see that it’s the same moving average which has been providing resistance during the last coupe of weeks as the price moves higher. Nikkei turned lower at the 50 SMA after the first attempt.
We got some pips during that move, by the way. Then we saw another attempt from the buyers to push above the 50 SMA by the end of last week, but again this moving average held its ground. Now, the direction is a bit unclear, but we will see whether the 50 SMA on the monthly chart or the 50 SMA on the daily timeframe will win this battle.