Previous Resistance Turns Into Support for Oil as it Breaks Out of the Range
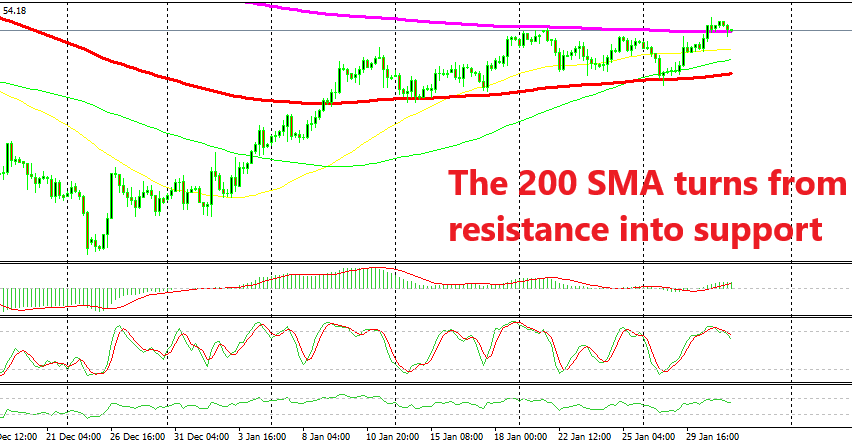
US WTI Crude Oil was finding solid resistance at the 200 SMA, but now it seems that the 200 SMA has turned into support.

Crude Oil has been trading inside a range for about a month since the beginning of January, after it made a bullish reversal at the end of December. The price of US WTI crude broke above three moving averages on the H4 chart, but it couldn’t push above the last one and it has traded inside a range between $54.50 and $51 during this time.
The buyers found solid resistance at the 200 SMA (purple) during the last four weeks, while the 100 SMA (red) has acted as support during this period. So, US Crude Oil has been bouncing up and down between these two moving averages which have defined the range.
We lost the chance to go long from the 100 SMA at the bottom of the range earlier this week after Oil formed a strong bullish reversal pattern down there with the stochastic indicator oversold on this time-frame and the hammer candlestick.
At least, we refrained ourselves from going short yesterday below the 200 SMA. Yesterday in the evening, WTI crude broke above the 200 SMA after the FED meeting and press conference where they sounded sort of dovish, or let’s say not as hawkish as last year.
As a result, Crude Oil jumped around 120 pips higher after the FED as the US Dollar weakened and WTI broke above the 200 SMA, also breaking the range as well. As we know, what was once resistance turns into support and vice versa, and now the top of the range which was provided by the 200 SMA has turned into support, it seems.
This could be a good opportunity to go long on Oil but the stochastic is overbought and turning lower, so we will see how the price behaves around here and if it can break below the 200 SMA again or the 200 SMA will hold as support now.
- Check out our free forex signals
- Follow the top economic events on FX Leaders economic calendar
- Trade better, discover more Forex Trading Strategies
- Open a FREE Trading Account


