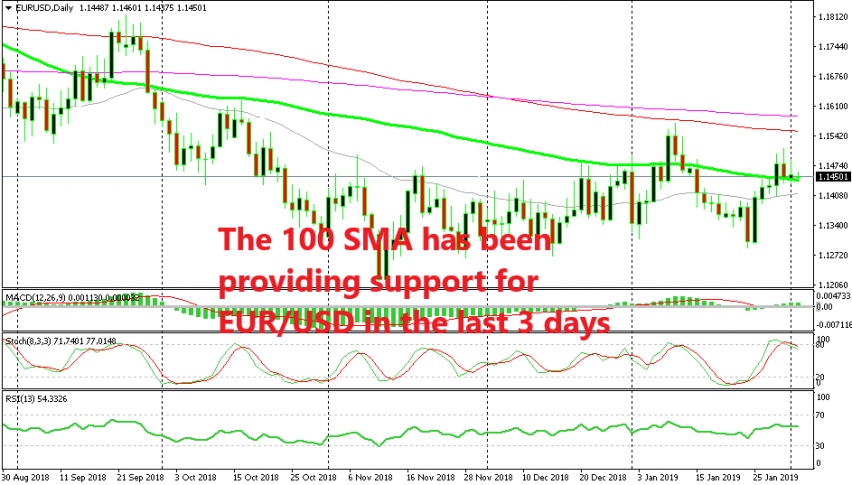
The 100 SMA Turns from Resistance to Support for EUR/USD


[[EUR/USD]] made a bullish reversal on Friday 25 as the USD turned bearish that day. The previous daily candlestick from Thursday was a pretty big one, worth around 100 pips from top to bottom. But, the following one was even bigger, which in the forex textbook is considered a bullish engulfing candlestick.
That’s a bullish reversal pattern, suggesting that the pair will make a bullish move in the coming days and indeed it did. EUR/USD climbed around 220 pips in total and pushed above the 100 SMA on the daily chart. That moving average has been working as resistance, pushing the price lower despite being broken a few times to the upside.
So, we moved above the 100 SMA and now it seems like this moving average has turned into support. In the previous breaks above the 100 SMA, the price has returned back below it without much hesitation. This time, EUR/USD has been finding support at the 100 SMA during the last three days.
What does this mean? Is EUR/USD turning bullish now and using this moving average as the support before the next move higher? Well, if the price doesn’t break it soon, then there is a decent chance that EUR/USD makes another bullish move.
In that case, the 100 smooth MA (red) would be the target which is a 100 higher at the moment. If you are thinking about going long, then below 1.14 would be the right place for the stop loss and the take profit target would be the 100 smooth MA giving you a 1:2 risk/reward ratio.