Gold Has Formed A New Range – Who Wants to Trade It?
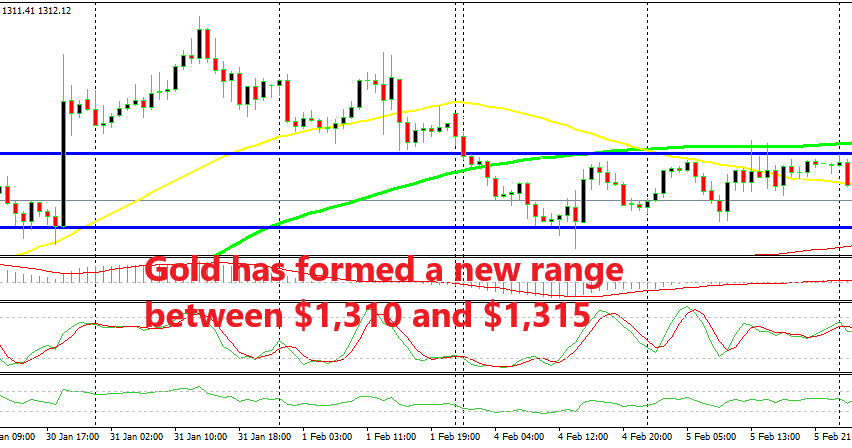
Gold broke above $1,300 two weeks ago after trading in a range below that level, but now it has formed a new range to trade

GOLD has been on a solid bullish trend since August last year. The last two months in particular Gold has made a strong bullish move, breaking above the big level at $1,300 and above the 100 SMA on the monthly chart, if you want to check that time-frame.
Although, the break above $1,300 came after Gold had traded inside a range during most of January. That range was defined by the $1,286-7 level at the bottom and the $1,295 at the top, more or less. That range was broken toward the end of last month and the break of $1,300 came soon after that.
The buyers pushed as high as $1,326 in the last day of January, but then the price started to slide back lower. Gold formed a support this week and the low on my platform this week comes at $1,308.50, but the support comes at $1,310, as you can see form the chart above.
Besides that, Gold has formed a resistance as well at $1,315, so that makes it a range, doesn’t it? We can also see the 100 SMA (green) at the top of the range providing resistance on the H1 chart, so the area around $1,315 seems like a good place to sell Gold. Now, this is the new range for GOLD. These ranges offer some good trading opportunities and we will try to make the best of it in the coming sessions if this sort of price action continues, buy at the bottom, sell at the top.
- Check out our free forex signals
- Follow the top economic events on FX Leaders economic calendar
- Trade better, discover more Forex Trading Strategies
- Open a FREE Trading Account


