Gold Trades Beneath Resistance – a Quick Technical Outlook
Gold came out of a sideways range of $1,317 - $1,310 to place low around $1,300. The RSI and Stochastics are stuck in the oversold zone..
•
Last updated: Thursday, February 7, 2019
Earlier today, the yellow metal gold was trading close to a more than one-week low on a stronger dollar. The uncertainties around the Sino-US trade dispute and worries over slowing global economic growth have supported gold above the psychological trading level of $1,300 level.
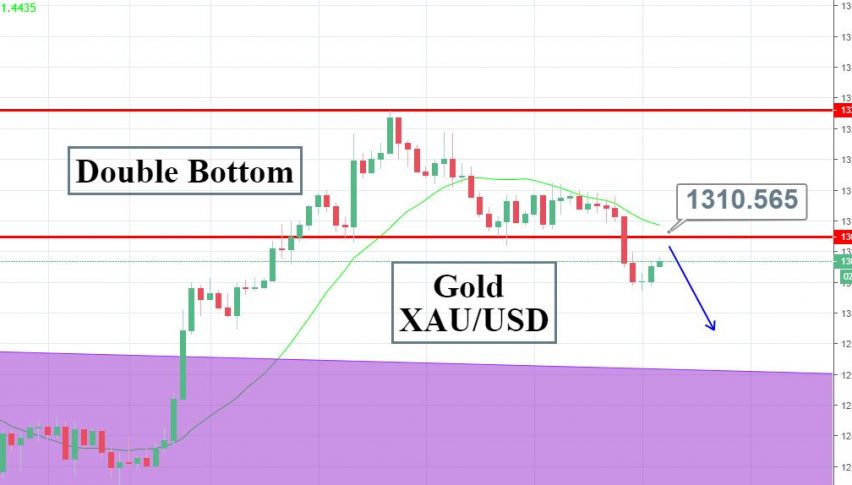
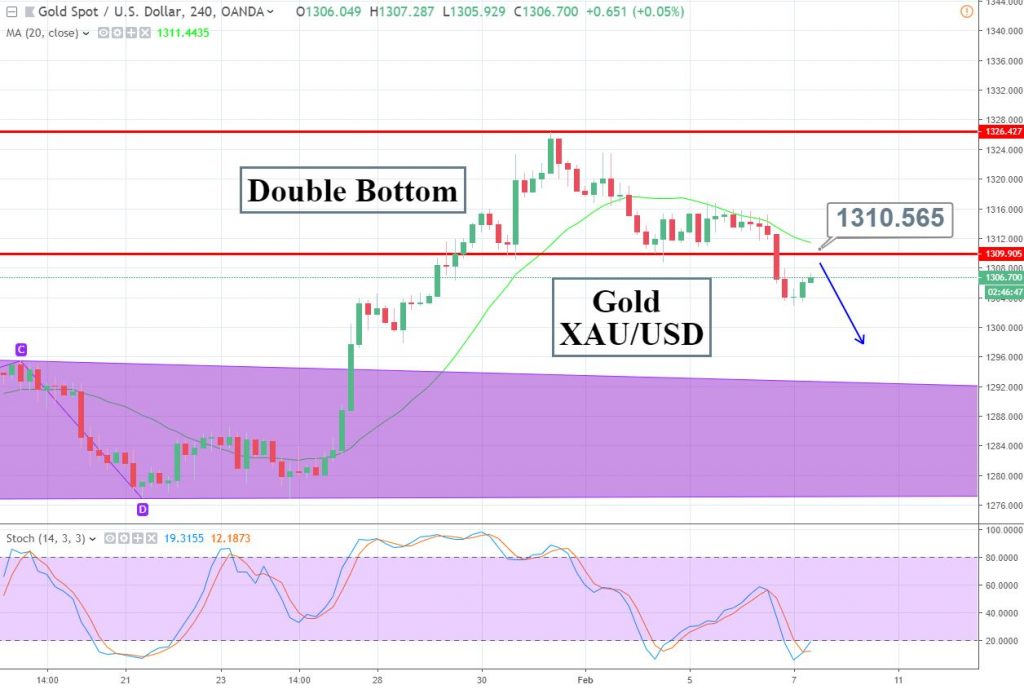
GOLD – Quick Technical Outlook
- As you see in the chart, gold came out of a sideways range of $1,317 – $1,310 to place low around $1,300.
- The RSI and Stochastics are stuck in the oversold zone, below 20, which is a clear signal that metal is oversold.
- We have a Doji pattern on the 4-hour chart, which is very likely to trigger bullish retracement.
- Gold has immediate resistance at $1,310 while support remains the same at $1,300.
- Although the short term projection is bullish, the long term projection is bearish for gold. The 20 periods EMA is also confirming the bearish bias of the market.
Gold – XAU/USD – Trade Plan
Consider staying bearish below $1,310 with a stop loss above $1,314 and take profit around $1,300.
Good luck!
- Check out our free forex signals
- Follow the top economic events on FX Leaders economic calendar
- Trade better, discover more Forex Trading Strategies
- Open a FREE Trading Account
ABOUT THE AUTHOR
See More
Arslan Butt
Lead Markets Analyst – Multi-Asset (FX, Commodities, Crypto)
Arslan Butt serves as the Lead Commodities and Indices Analyst, bringing a wealth of expertise to the field. With an MBA in Behavioral Finance and active progress towards a Ph.D., Arslan possesses a deep understanding of market dynamics.
His professional journey includes a significant role as a senior analyst at a leading brokerage firm, complementing his extensive experience as a market analyst and day trader. Adept in educating others, Arslan has a commendable track record as an instructor and public speaker.
His incisive analyses, particularly within the realms of cryptocurrency and forex markets, are showcased across esteemed financial publications such as ForexCrunch, InsideBitcoins, and EconomyWatch, solidifying his reputation in the financial community.


