The 100 SMA Turns Form Resistance Into Support in EUR/CHF
EUR/CHF has been sliding lower in the ladt 3 days, but it is finding solid support at the 100 SMA on 2 different time-frames
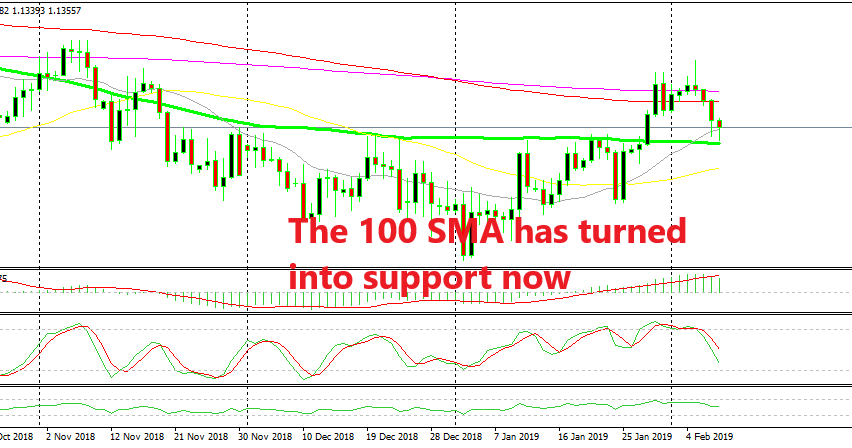
EUR/CHF turned bullish towards the end of January as the market sentiment improved further, sending risk assets such as stocks higher and safe havens such as the CHF lower. The Euro took advantage of that and gained against the CHF, breaking above a number of moving averages, in particular the 100 SMA (green).
That moving average had been providing support for two months since the middle of November. The price broke above the other two moving averages standing on top of the 100 SMA, but then started reversing down and the 100 SMA which was providing resistance before, is now providing support as you can see from the daily EUR/CHF chart above.
The stochastic indicator is now close to the oversold area, which tells us that the decline might be over soon. The daily candlestick is closing as a hammer which is a bullish reversing signal after the three day decline. If it closes as a pin, it will be an even stronger reversing signal.
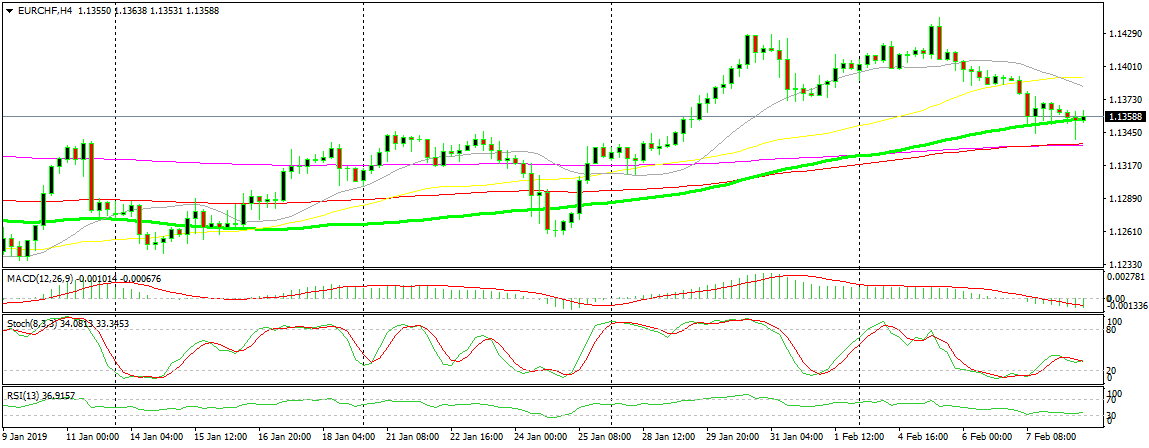
The 100 SMA is providing support here as well
If we switch to the H4 chart, we see that the same moving average is providing support here as well. The price pierced below it this morning, but it retraced back up and closed the previous candlestick above it. Speaking of the candlestick, it formed a doji which is also a bullish reversing indicator and this H4 candlestick already looks bullish. These tow chart formations point up, so let’s hope that the bullish trend resumes again after refreshing lower.
- Check out our free forex signals
- Follow the top economic events on FX Leaders economic calendar
- Trade better, discover more Forex Trading Strategies
- Open a FREE Trading Account


