Gold Heads Towards the Support Again After Failing at Resistance
Gold has been retracing lower today, but it is heading towards a strong support level which might reverse the price back up again

GOLD made the major break above the $1,300 level in January and it has traded above that level since then. This shows that buyers are in control since sellers can’t push below that big round level, but the price is not moving too far above this zone either.
Gold reached the highs in the last day of January, but that was the day of the reversal as well. Gold formed a doji candlestick on the daily chart that day which is a reversing signal and a bearish pullback lower followed in the coming days.
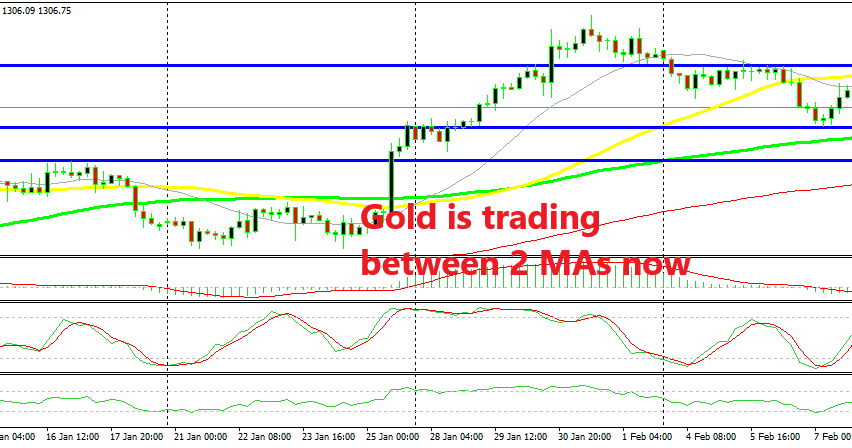
But, the level at $1,302 held the decline and it seems like this level has turned into support now. This level falls into the support zone surrounding the $1,300 level, so it is not a surprise to see the resistance turn into support now. The buyers tried to resume the uptrend after Gold formed a doji candlestick on the H4 chart as you can see above.
But, another resistance level has formed at $1,315 which is where we find the 50 SMA (yellow) as well on this time-frame chart. The buyers failed to push above this new resistance level last Friday and the stochastic indicator became overbought, meaning that the bullish move was complete.
Today, GOLD has lost around $8 from top to bottom and it is now heading towards the support area again. Now we see that the 100 SMA (green) has reached that level which should add some more strength to it. We will wait for the price to get down there and see how it reacts at the support area.
Stochastic is heading down and by that tie it will be oversold, which means that the pullback on this time-frame will be complete. If the price starts acting funny down there and we see a reversing signal such as a doji or hammer/pin candlestick, then we might go long on Gold from there. But first, let’s see the price action as we head down there.
- Check out our free forex signals
- Follow the top economic events on FX Leaders economic calendar
- Trade better, discover more Forex Trading Strategies
- Open a FREE Trading Account


