The H4 50 SMA Turns Form Support Into Resistance For GBP/USD
GBP/USD has turned bearish in the last two weeks and the previous support indicator which was the 50 SMA has now turned into resistance.
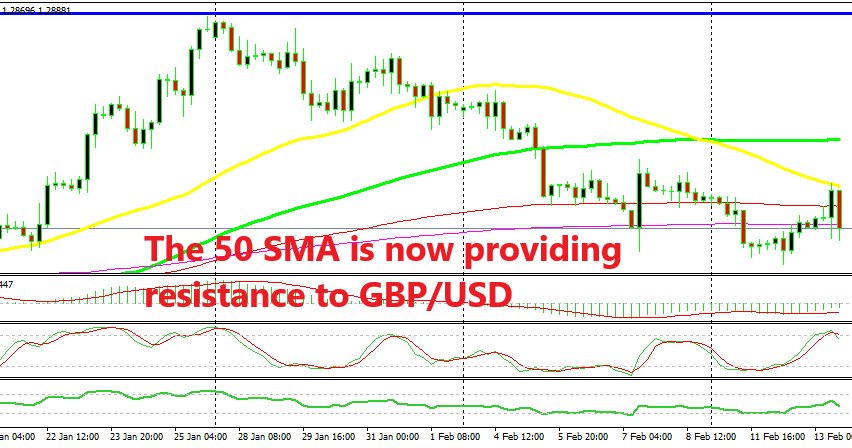
[[GBP/USD]] was trading on a bullish trend for most of January after it bottomed out at 1.24 lows in the first trading day of this year. This pair climbed around 8 cents during this period and the indicator which was defining the uptrend was the 50 SMA (yellow) as it provided support during the pullbacks.
But, the sentiment surrounding Brexit changed and the trend for the GBP/USD shifted from bullish to bearish. The price broke below the 50 SMA and all the other moving averages. The 100 SMA (red) provided support for some time last week, but that moving average was broken as well.
That put the sellers in total control, not that any side has a clear hand on the GBP since Brexit is driving the price action now. Although, we can see that the sellers are in control because the precious support, has now turned into resistance. That’s the 50 SMA which provided resistance during the spike on some positive Brexit rumours this morning. This moving average stands at 1.2950 at the moment and it looks like a pretty good place to go short from, so if you are thinking of selling GBP/USD, keep this moving average in mind on the H4 hart.
- Check out our free forex signals
- Follow the top economic events on FX Leaders economic calendar
- Trade better, discover more Forex Trading Strategies
- Open a FREE Trading Account
- Read our latest reviews on: Avatrade, Exness, HFM and XM
Related Articles
Sidebar rates
Related Posts
