Gold Faces Technical Indicators as it Heads Down


GOLD made the big break above the major $1,300 level at the end of December and it continued the bullish run in January. But, it started reversing lower at the end of last month, since all trends need a refresh after a major move and Gold puled back to $1,302.60 last week.
The buyers tried to resume the uptrend, but they couldn’t make new highs, so Gold has traded sideways this month. The price has formed a range in the last two weeks between $1,302-3 at the bottom and roughly $1,3015 at the top. The price has bounced up and down during this time and now we are close to the bottom of that range once again.
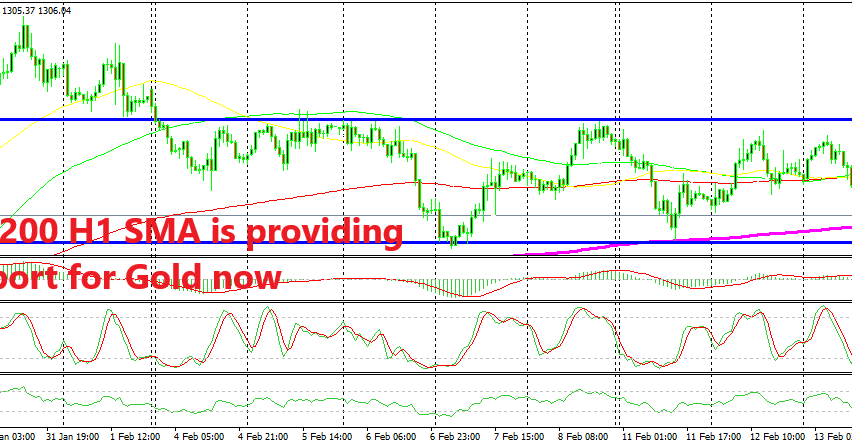
The 200 SMA (purple) has caught up with the price now on the hourly chart, which has been providing support twice this week. The price is finding it difficult to break below this moving average today, which is one major obstacle for the sellers. If they manage to push below the 200 SMA, then comes the support area at $1,302-3 and after that, the big level at $1,300.
If you have sold Gold, then watch out for these three levels/indicators. If they’re broken, then the the downside has some potential and should offer some some more pips. If the price hangs too long at these support indicators, then a bounce should follow, so better follow the price action if you are already on a trade in Gold.