Selling the Pullback in GBP/USD at the 100 SMA
GBP/USD has been on a bearish trend in the last 3 weeks. Although, it retraced higher on Friday but the retrace seems complete now.
[[GBP/USD]] turned bearish at the end of January as it became increasingly clear that the Irish border backstop agreed by the EU and the UK Prime Minister Theresa May isn’t going to work for the UK Parliament. As a result, GBP/USD has been trading on a bearish trend during the last three weeks.
Although, on Friday last week, the USD turned bearish after climbing higher for several weeks and this forex pair retraced higher. But, the retrace is complete on the H4 time-frame now as we see from the chart above, so we decided to try the short side and just opened a sell signal around here.
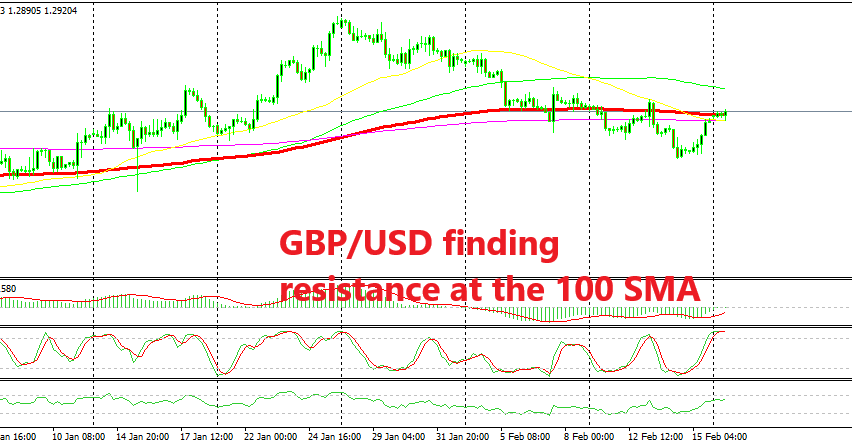
The stochastic indicator is overbought which means that the pullback higher is complete. The price has formed a few doji candlesticks after the pullback, which are bearish reversing signals. Another strong technical indicator pointing to a possible reversal is the 100 SMA (red).
This moving average provided support on the way down two weeks ago and before that at the beginning of January. If you scroll your chart further back, you can see that this moving average used to provide resistance before, which means that it is a strong support and resistance indicator.
This makes four technical indicators pointing to a bearish reversal, so we went short on GBP/USD, and now let’s wait for the reversal to come.
- Check out our free forex signals
- Follow the top economic events on FX Leaders economic calendar
- Trade better, discover more Forex Trading Strategies
- Open a FREE Trading Account


