RBA Helps AUD/USD Form a Bearish Reversal on the Daily Chart
AUD/USD was retracing higher last week, but the retrace is now complete and a bearish reversal is forming with the help of the RBA...
The Reserve Bank of Australia RBA released the minutes from their last meeting and they confirmed once again that they are not that keen on hiking interest rates anymore. They used to lean on the hawkish side regarding rate hikes but now the scenarios between hiking and cutting interest rates are balanced. That’s not exactly a shift to dovish, but it is a shift from hawkish to neutral.
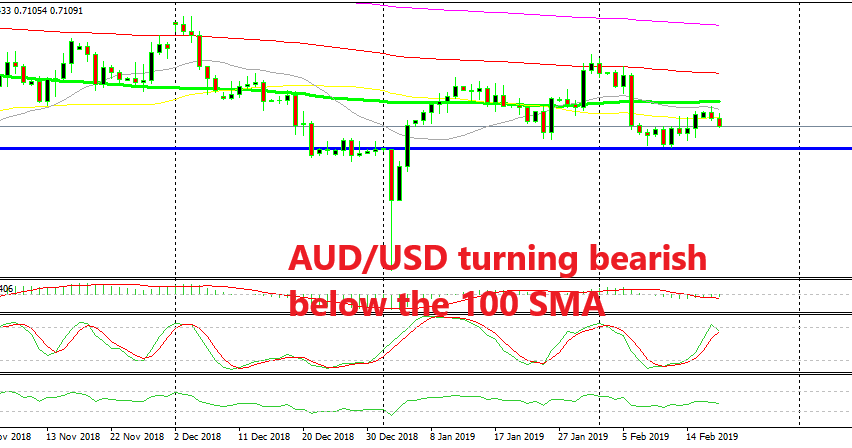
AUD/USD made a bearish reversal yesterday right below the 100 SMA (green) on the daily time-frame, together with the other commodity Dollars. The RBA is adding to that sentiment for the Aussie and this pair is forming a bearish reversal on this chart now.
As you can see from the image above, AUD/USD became overbought on the daily chart as stochastic indicator shows, meaning that the pullback higher is complete. Yesterday’s candlestick closed as an upside-down hammer, which is a reversing signal, and today’s candlestick looks pretty bearish already, which confirms the bearish bias.
If this scenario is to play out, then the first target will be 50 pips lower at 70.50 which was the low this month, followed by the big round level at 70. So, if you are trading AUD/USD, keep this chart and these levels in mind.
- Check out our free forex signals
- Follow the top economic events on FX Leaders economic calendar
- Trade better, discover more Forex Trading Strategies
- Open a FREE Trading Account


