Buying the Pullback in Crude Oil During this Uptrend
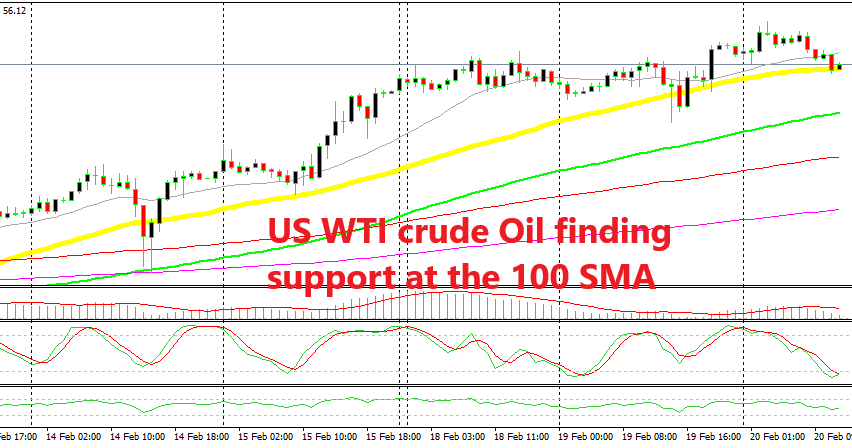
US crude Oil has retraced to the 50 SMA on the H1 chart, but the trend is still up. So, we decided to use this chance and go long on Oil

Crude Oil made a bullish reversal at the end of December last year as we have mentioned many times recently, pushing around $14 higher. There was a hesitation at the beginning of this month when US WTI crude found resistance at the 100 SMA (green) on the daily chart, but after a retrace lower which refreshed the trend, Oil resumed the uptrend and made the second leg higher.
The trend is back in play now and since the pullback, the price action has been pretty straightforward. The uptrend has been consistent in the last two weeks with the 50 SMA (yellow) defining it on the H1 chart. The 20 SMA (grey) and the 100 SMA (green) have also helped keep the trend in place, providing support when the 50 SMA couldn’t.
Today we’re seeing another retrace lower to the 50 SMA on the H1 chart. The price is already finding support at this moving average and the stochastic indicator is oversold, which means that the pullback is complete.
So, we decided to go long on US Crude Oil from here. Although, I would have liked to see a confirmation of a reversal such as a doji or pin candlestick. But you can’t have it all, all the time, can you? Let’s see now if the buyers remain in control; if they do, then we should see a bullish move take place soon.
- Check out our free forex signals
- Follow the top economic events on FX Leaders economic calendar
- Trade better, discover more Forex Trading Strategies
- Open a FREE Trading Account


