Look at This Chart! Could This Be the End of the Nightmare for Bitcoin Bulls?
Cryptocurrencies had a terrible year in 2018 but Bitcoin has reached a point where it might reverse back up now
BITCOIN and the rest of cryptocurrencies had such a terrible year in 2018 after the insane “Gold Rush” for digital currencies during H2 2017 and particularly in the last three months, altcoins turned bearish in December of that year and then came the crash lower in 2018. Bitcoin lost around 80% of its value during the last year from top to bottom, but I know there are still crypto bulls out there. These people bought Bitcoin or other major cryptos during the Q1 of last year as the price was declining with the idea that this dip pullback was a good opportunity to get on the long side a bit late.
I know people who bought Bitcoin at around $10,000 and are still hoping for a reversal. But quite often, during such “Gold Rush” periods, the ones who pay are the late comers. The reverse never came and the decline continued, until the $6,000 level where it found support for several months. But then, even that level was broken and Bitcoin fell to $3,200. Some of the guys I know are several thousand dollars in red now, but there is one last hope for them. In fact, this might be quite a strong case for a long term bullish reversal.
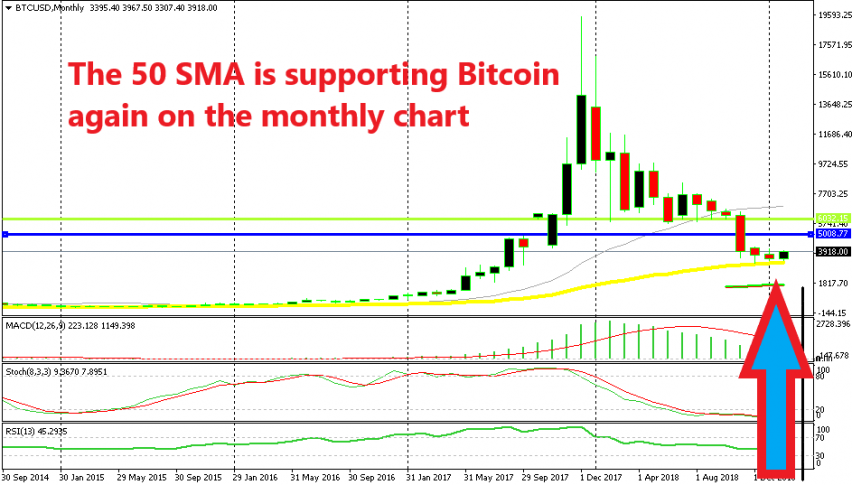
As you can see from the monthly chart above, Bitcoin used to find support at the 50 SMA (yellow) as far back as as this chart shows. The price leaned on this moving average late in 2014, 2015 and early 2016. Then Bitcoin started to take off that year and 2017 was stellar for all cryptocurrencies. The price surged that year and then crashed in 2018.
So, here we are now, trading between $3,000 and $4,000 since November last year. But as I said, there is still hope for buyers. The price has turned back to the 50 SMA now and the promising sign is that the 50 SMA is holding its ground once again. The price hasn’t been able to break below this moving average in the last three months.
Actually, a soft bullish reversing pattern seems to be forming now. The December candlestick formed a hammer with the bottom of the wick at the 50 SMA while January’s candlestick closed as a small spinning bottom. This month’s candlestick already looks bullish, so a reversal might as well be underway. If not a proper reversal, then a decent bounce to $5,000, $6,000 or even $10,000 looks possible.

Bitcoin is bound by to moving averages inside a range on the weekly chart
Then we switch to the weekly time-frame and see that BITCOIN is trading between two moving averages here. The 200 SMA (purple) is catching up with the price and is now below the support level at $3,200 which should add more strength to that support area, while at the top we have the 100 SMA (red). The buyers face a tough challenge, but if they really mean to make the big reversal then they should take out the 100 SMA which stands at the resistance area around the $4,100 level.
So, this will be the first test for buyers. If they push above this moving average and the $4,200 level, then they have a chance. I will let my friends know when this level is broken. Those who are in red will be interested so they can claim some of their money back, while those who are out of the game can look to make some money.
- Check out our free forex signals
- Follow the top economic events on FX Leaders economic calendar
- Trade better, discover more Forex Trading Strategies
- Open a FREE Trading Account
- Read our latest reviews on: Avatrade, Exness, HFM and XM
Related Articles


Sidebar rates
Related Posts
