Can GBP/USD Stay Above the 100 SMA Now?
A Brexit delay is improving the sentiment for the GBP, but will GBP/USD break the 100 SMA on the weekly chart?
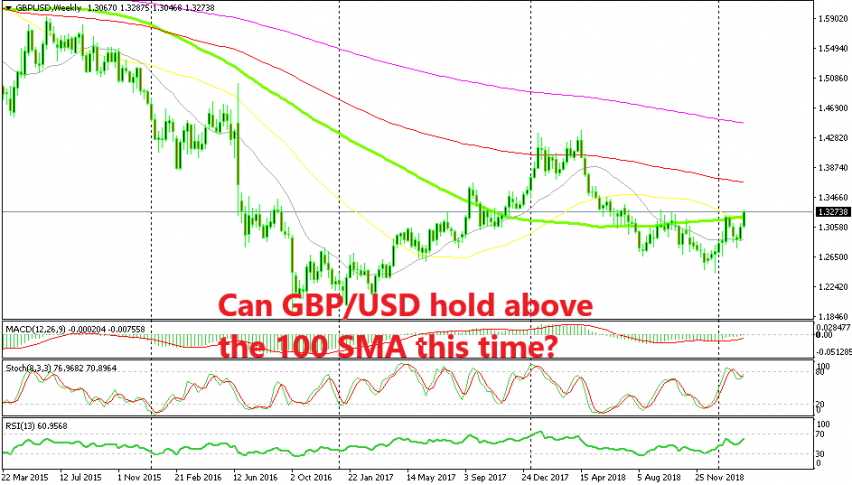
The stars are aligning for the GBP once again for a decent bullish move. This pair started to make a reversal at the end of last year and it shot higher in January. But, the 100 SMA (green) and the 50 SMA (yellow) provided resistance on top at 1.32 and during the first three weeks of February, the price retraced lower on the weekly chart.
But, the 20 SMA (grey) held its ground as support and GBP/USD formed a hammer candlestick which is a reversing signal after the retrace lower. In the last two weeks, we have seen this pair climb around 500 pips, but can it hold on above this moving average? The 100 SMA has been pierced many times since GBP/USD broke it to the downside and it has moved above this moving average again. But the price has returned below it eventually.
Fundamentals are supporting the bullish move in GBP pairs. Not that the British economy is doing well, instead it is in a very weak spot. But Brexit is driving the GBP and it seems like Brexit might be postponed by a few months. The markets see this as a relief, at least for the time being.
That’s because the odds of a no-deal Brexit are going up by the hour as we approached the deadline which is March 29. An extension would at least subdue this risk for some time and probably a solution will be found until then, although don’t bet your house on it. But, this is what’s supporting the GBP at the moment. The 100 SMA might actually go this time, let’s see.
- Check out our free forex signals
- Follow the top economic events on FX Leaders economic calendar
- Trade better, discover more Forex Trading Strategies
- Open a FREE Trading Account