The 50 SMA Holds in S&P500 as Geopolitics Keep Messing With Markets
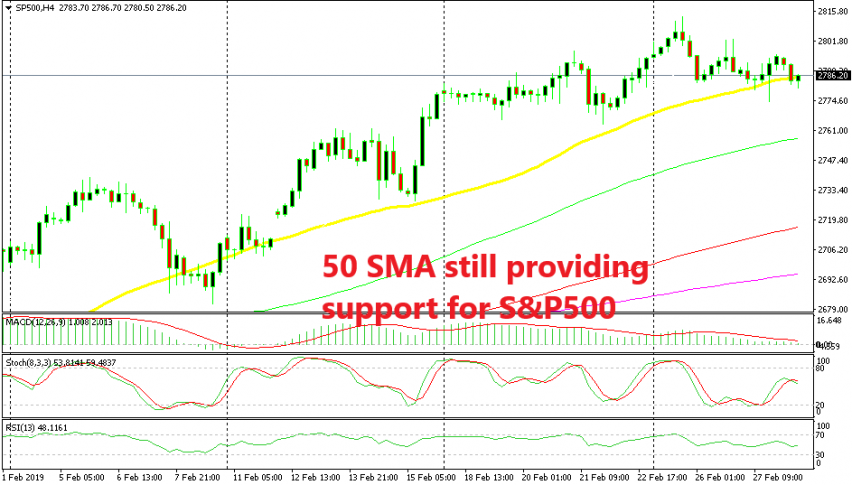
S&P500 has slipped lower on geopolitics again today but the 50 SMA is still providing support

Stock markets have been on a decent bullish trend for about two months, but this week they have had some difficulties pushing higher. S&P500 has traded in a range which could be a normal retrace or consolidation before the next bullish move. As the chart above shows, the uptrend unfolds in waves. But, it’s more than that.
Geopolitics are hurting the market sentiment and that’s the main reason for this retrace in stock markets. Donald Trump and the North Korean leader Kim Jong Un had a meeting yesterday but they didn’t reach a deal from what I can see. Staying in Asia, the skirmish between India and Pakistan continues as India has refused to negotiate regarding the captured pilot.
That sent the stock markets down again during the Asian session, as you can see from the last two bearish candlesticks on the H4 chart above. Yesterday, S&P pierced the 50 SMA (yellow) late in the European session but it reversed up in the US session and climbed more than 20 points, so the break didn’t count since that candlestick didn’t close below the 50 SMA.
Now the price is back here again and it has pierced this moving average, but is still climbing above it. So, it seems like the 50 SMA is still holding on for S&P500. We surely hope that it holds its ground because we have a long term buy signal in this index. If this H4 candlestick closes as it is (hammer) above the 50 SMA, then it would be a bullish reversing signal. We’re holding on to our trade now hoping that the reverse will come soon.
- Check out our free forex signals
- Follow the top economic events on FX Leaders economic calendar
- Trade better, discover more Forex Trading Strategies
- Open a FREE Trading Account


