European and UK Data Still Showing Weakness
The inflation report from the EU shows some contradicting numbers while UK manufacturing continues to decline

The round of economic data from Britain and from the Eurozone is out and the numbers still show that both economies are in a difficult spot. The manufacturing sector in Britain made another step towards stagnation, although at 52 points it is still a bit far, unlike other sectors of the UK economy which are pretty close to stagnation such as construction. Let’s have a look at all the numbers below:
| Economic Data | Actual | Expected | Previous |
| UK Manufacturing PMI | 52.0 | 52.0 | 52.6 |
| Net Lending to Individuals | 4.8B | 4.7B | 4.6B |
| Mortgage Approvals | 67K | 63K | 64K |
| Headline CPI | 1.5% | 1.5% | 1.4% |
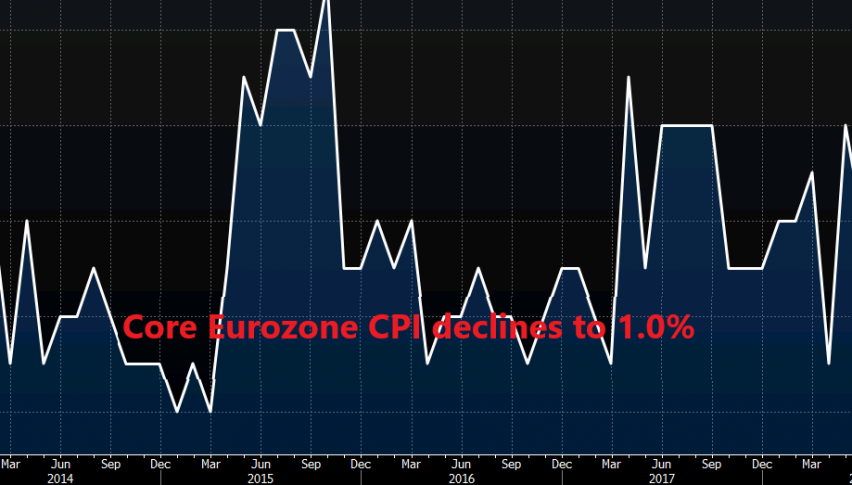
| Core CPI | 1.0% | 1.1% | 1.1% |
| Unemployment Rate | 7.9% | 8.0% | 8.0% |
The headline annualized CPI ticked higher to 1.5% in February from 1.4% previously and the unemployment rate ticked lower in the Eurozone, but core CPI (consumer price index) ticked lower to 1.0% from 1.1% in January. The ECB is still hoping for signs that sustainable inflation pressures will pick up. Well, core CPI reflects sustainable inflation better than anything else and it is still slipping lower.
What do you read in this inflation report from the Eurozone? This report shows that the bullish reversal in Crude Oil prices are having some effect on headline inflation which ticked higher, but core inflation which strips out Oil prices and shows the real inflation is ticking down. That’s a negative sign pointing to further weakness in the coming months.
- Check out our free forex signals
- Follow the top economic events on FX Leaders economic calendar
- Trade better, discover more Forex Trading Strategies
- Open a FREE Trading Account


