Weekly Crypto Roundup
We take a look at the technical analysis on BTC, Ethereum and the total market capitalization.
While many expected the cryptocurrencies market to continue flourishing due to the positive outlook prior to this week, the uptrend came to an end soon with a heavy decline of more than ten percent in a single day on the 24th of February. Despite the recent market turndown, there were bullish headlines again. So, before we come to the positive news, we take a look at the technical analysis on BTC, Ethereum and the total market capitalization.
BTC/USD DAILY CHART
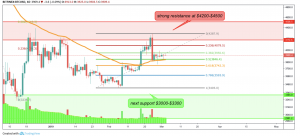
BTC rallied all the way up to the resistance at $4200, where it faced heavy rejection and endured a loss of more than ten percent. The 50-day-EMA held successfully as support so far and Bitcoin is currently ranging between this support and the 0.382 fib level, where it faced rejection several times so far. If Bitcoin falls below the golden pocket at $3740, it seems likely that Bitcoin is heading to its next strong support between $3000 and $3300.
BTC/USD WEEKLY CHART
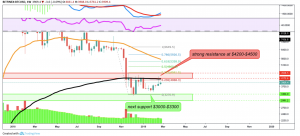
The weekly MACD is bullish and the RSI is quite neutral at the moment. With three green candles out of four in total, Bitcoin’s weekly chart is quite bullish. However, the 200-week-EMA acts as additional resistance at the exact same spot where the 0.236 fib extension level is located, which is at the major resistance at $4200. If Bitcoin manages to break the resistance, it will most likely face its next resistance at the 50-week-EMA, at around $5400.
BTC/USD MONTHLY
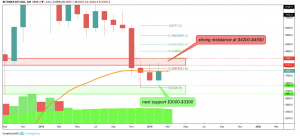
Bitcoin’s monthly chart gives both bullish and bearish signals. On the bullish side, Bitcoin formed an engulfing candle, which is a bullish reversal candle. Having said that, the February candle failed to close above the 50-month-EMA which could deny the bullishness. Thus, Bitcoin needs to break the 50-month-EMA before we can assume a re-test of the resistance area between $4200-$4500.
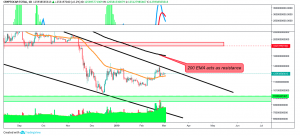
ETH/USD DAILY
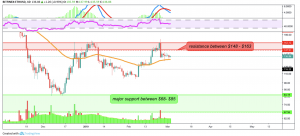
Ethereum was rejected almost exactly at the upper part of the strong resistance at around $160. While the 50-day-EMA successfully acted as support so far, the MACD crossed bearishly. Ethereum gives no clear signals at the moment and will most likely follow the price movement of Bitcoin.
TOTALMARKETCAP DAILY CHART
The total market capitalization faced rejection at the channel resistance at $141b and fell down to $120b. The 50-day-EMA held as support so far, but despite the increase in volume, there are no clear signals indicating a potential break of the resistance. However, if the channel resistance is broken, the 200-day-EMA will act as the next major resistance, sitting at around $165b.

Cryptopia finally gave an update on its website maintenance. It will most likely open its exchange on Monday again. This is a ray of hope for its users, as only approximately ten percent of the funds were stolen according to Cryptopia’s calculations.
According to BTCNN, the Cabinet of Germany declared that there are plans to launch a blockchain strategy in the country which will come into place during 2019.
What’s more, Facebook apparently launches its Facebook Coin much sooner than expected. The New York Times (NYT) report stated that Facebook employees might already be shopping the coin to cryptocurrency exchanges while ‘trying to get the product out in the first half of the year.’
This week’s biggest gainers were ENJI, which rose by 224 percent, and RVN, which rose by 105 percent.
- Check out our free forex signals
- Follow the top economic events on FX Leaders economic calendar
- Trade better, discover more Forex Trading Strategies
- Open a FREE Trading Account
- Read our latest reviews on: Avatrade, Exness, HFM and XM
Related Articles
Sidebar rates
