Daily Brief, March 4: Trading EUR/USD & USD/CAD Today
The market humiliated the US dollar upon a series of weak economic events. The US President Donald Trump again criticized the Fed by...
Welcome back, traders. I hope you have had an awesome weekend. The market humiliated the US dollar over a series of weak economic events. The US President Donald Trump again criticized the Fed by taking aim on their monetary policy and strong Greenback. The stronger dollar has never been a priority of the POTUS Trump as it hurts exports and widens the trade deficit.
The ongoing tensions between India – Pakistan began to subside as Pakistan released the Indian fighter jet pilot it had caught in the crash a day sooner. The pilot returned on Friday. Good thing is that the train service between the two countries, discontinued during the tensions, is set to resume on Monday. It can trigger risk-on sentiment in the global stock markets.
The current week is all about fundamentals, especially the US Nonfarm payroll and unemployment rate are at the top of the list. Anyway, we are going to take a quick look at the EUR/USD and USD/CAD trade setups.
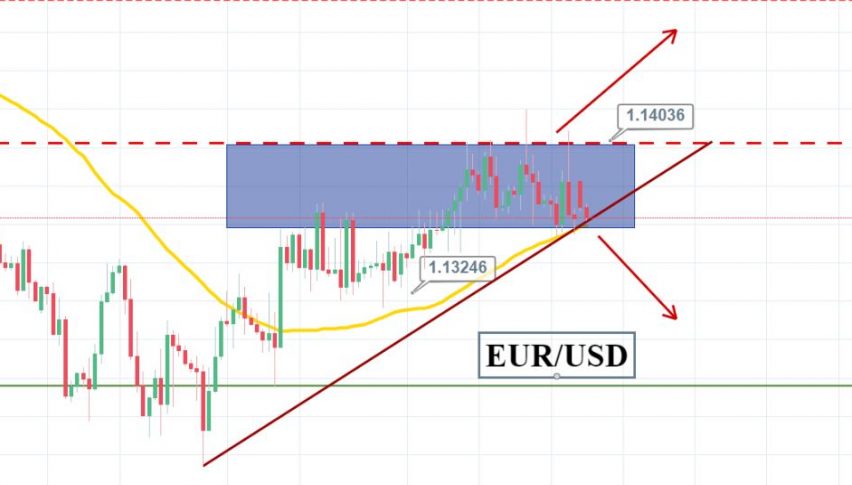
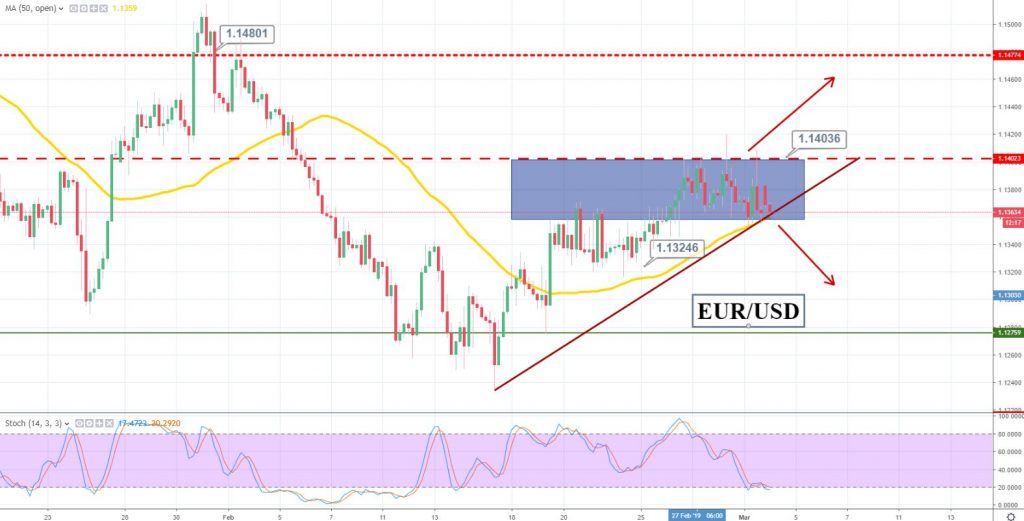
EUR/USD – Ascending Triangle Pattern
The single currency Euro is consolidating in a narrow trading range of $1.1400 – $1.1360.
The leading indicators like Relative Strength Index and Stochastics are holding below 50, signaling a bearish bias of traders. In fact, these indicators are testing 20 levels which can trigger a bullish retracement above $1.1355 today.
The pair is trading in an ascending triangle pattern which is supporting it around $1.1350 along with a resistance level. Upward breakout at $1.1400 can extend bullish rally towards $1.1470. While the bearish breakout can cause a drop towards $1.1320.
Support Resistance
1.1321 1.1414
1.1277 1.1464
1.1183 1.1558
Key Trading Level: 1.137
EUR/USD – Trade Plan
Consider selling below $1.1400 with a minor stop loss above $1.1420 for a quick 50 pips take profit. While buying is preferred above $1.1410 to target $1.1460.
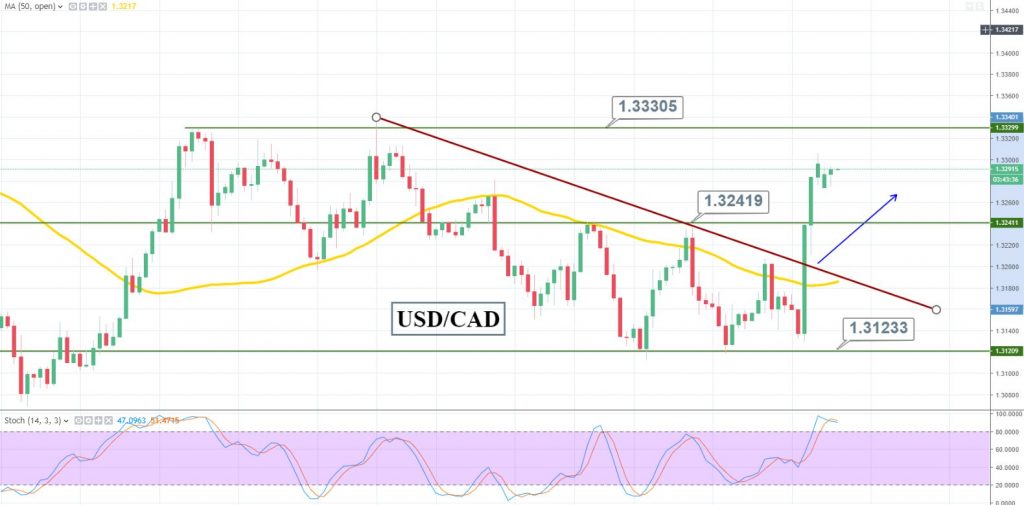
USD/CAD – Canadian dollar Crushed by Final-quarter GDP
The Canadian Dollar collapsed on Friday over worse than expected GDP figures. Canada’s economy shrunk by -0.1% in December for a second consecutive month, which means that GDP grew by just 0.1% overall in the final quarter of 2018.
Taking a look on the US dollar to Canadian dollar 4-hour chart, the pair has violated a descending triangle pattern in the upper side. The $1.3240 resistance level has been violated and it’s likely to head towards $1.3330.
The price has crossed above 50 periods EMA which is representing a bullish bias of traders.
Support Resistance
1.3172 1.3368
1.3044 1.3436
1.2849 1.3631
Key Trading Level: 1.324
USD/CAD – Trade Plan
Fellas, I will wait for the market to test $1.3330 trading level before placing any position in the pair. The alternate scenario will be to stay bearish below $1.3270 with a minor stop loss above $1.3310.
All the best and stay tuned to FX Leaders for more updates & forex trading signals.
- Check out our free forex signals
- Follow the top economic events on FX Leaders economic calendar
- Trade better, discover more Forex Trading Strategies
- Open a FREE Trading Account
- Read our latest reviews on: Avatrade, Exness, HFM and XM
Related Articles


Sidebar rates
Related Posts
Ava

