Waiting on a Break as Bitcoin Trades Between Moving Averages
Bitcoin failed to break the $4,000 level in February and reversed lower. But it is stuck between moving averages now

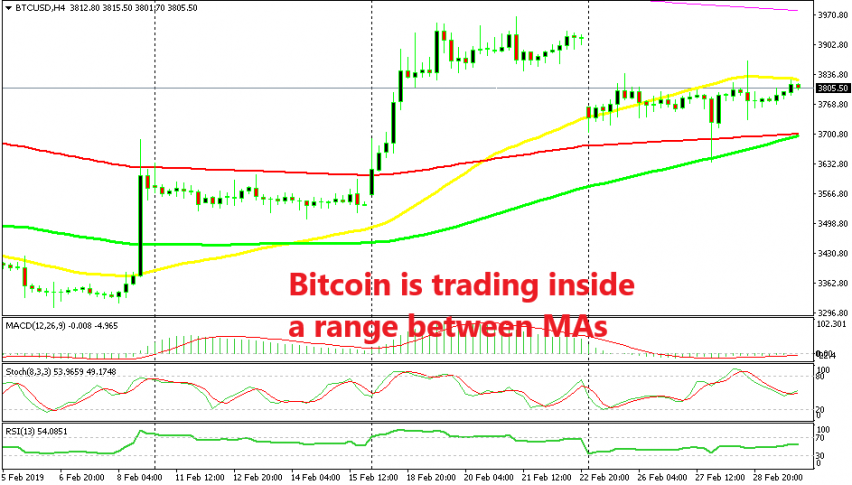
Crytocurrencies had a good month in February; they traded in a bullish trend with BITCOIN climbing from $3,300s to $4,000. It’s not a really big move compared to the major bearish moves we saw last year, but it is a bullish move nonetheless, and these have been quite rare since the major “Gold Rush” ended in December 2017.
People who have been bullish on cryptocurrencies got excited by this bullish move, but their hopes started to fade after Bitcoin failed to break and hold above the $4,000 level. Then came the decline last weekend and Bitcoin lost around $200-$250. The price found support at the 50 SMA (yellow) for some time on the H4 chart at the beginning of the week, but that moving average was broken and the price slipped lower to around $3,650, depending on your broker’s price feed.
But, the 100 simple moving average (green) provided support and Bitcoin retraced higher again. Although, the buyers couldn’t push above the 50 SMA which provided resistance until the end of the week. So now, Bitcoin seems to be stuck between the 50 SMA on top and the two 100 SMAs at the bottom.
The next move will depend on which side will let go first. If the 50 SMA gets broken, then the next target will again be the resistance zone surrounding the $4,000 level. If the 100 simple (green) and smooth (red) MAs get broken, then the target will be the $3,500 level and then comes $3,300. But, we will have to be patient and wait for the break which might take some time.
- Check out our free forex signals
- Follow the top economic events on FX Leaders economic calendar
- Trade better, discover more Forex Trading Strategies
- Open a FREE Trading Account


