Gold Forms a Bearish Reversing Pattern Below Long-Term Resistance
Gold is declining fast after forming a spinning top candlestick in February
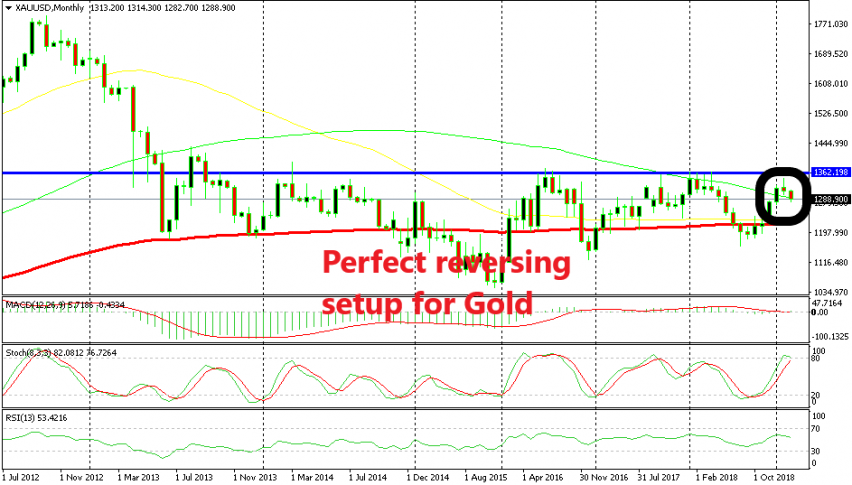
GOLD made quite a bullish reversal at the end of summer last year after it formed a doji or a spinning bottom candlestick, if you want to call it that, on the monthly chart, which is a reversing signal after the downtrend during the first half of 2018. The buyers pushed above the 100 SMA (green) in January this year and they also broke the big round level at $1,300.
But, they couldn’t push above the long-term resistance zone which stretches from $1,345 until $1,375. Actually, the price formed a spinning top in February which again is a reversing signal, this time a bearish reversing signal since the trend was bullish for months before that candlestick.
I did highlight the upside-down hammer candlestick on the daily chart two weeks ago which is also a bearish reversing signal. The reverse began after that and now that February is over, the reversal is taking shape properly. The stochastic indicator is overbought and is now reversing down, which suggests that the bullish move is complete.
The first target for this move is the 100 SMA (red) at $1,222, so that’s a $65 target. I wish I could have sold two weeks ago near $1,340; by now I would be $50 in profit. But, there might be a retrace higher coming, so I’m keeping an eye on the long term charts for Gold.
- Check out our free forex signals
- Follow the top economic events on FX Leaders economic calendar
- Trade better, discover more Forex Trading Strategies
- Open a FREE Trading Account
- Read our latest reviews on: Avatrade, Exness, HFM and XM
Related Articles

Sidebar rates
Related Posts
