Playing the Range Between 2 MAs in EUR/JPY
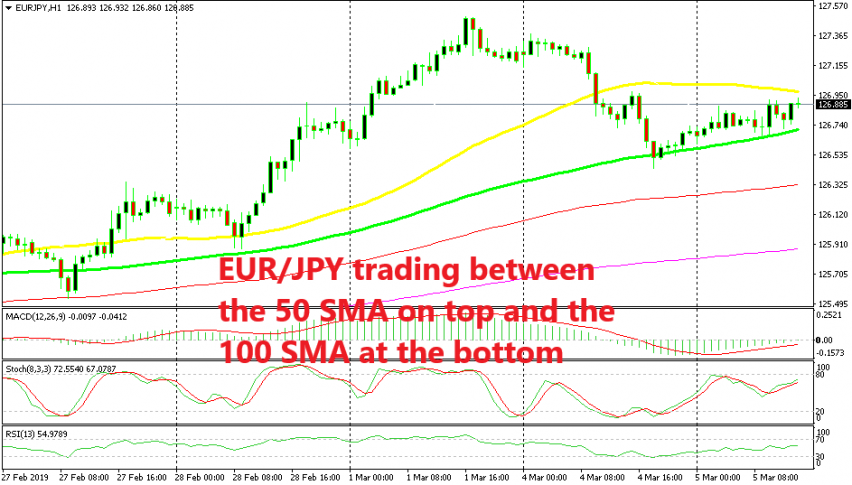
EUR/JPY turned bearish yesterday and it has been trading between two moving averages since then. We just sold at the top MA

EUR/JPY has been trading in a bullish trend since the beginning of January and the uptrend gained pace towards the end of February. But, we saw a trend reversal yesterday as EUR/USD made a move lower to 1.1310 while USD/JPY made the first decent bearish retrace since a week ago.
As a result, EUR/JPY lost 90 pips from top to bottom. While you might argue that this might not exactly be a trend reversal just yet, the pressure has shifted to the downside now. You can see that from the price action of this pair in the last two sessions since it found support at the 100 SMA (green).
EUR/JPY has bounced back up pretty quickly after previous pullbacks lower during this uptrend, but this time it has taken two trading sessions for this pair to climb 50 pips. This means that the buyers don’t have enough stamina to push the price higher and resume the uptrend.
For this reason, I decided to go short just a while ago right below the 50 SMA (yellow). This pair has been trading between these two moving averages since yesterday and the 50 SMA has now turned into resistance. Right now the price has slipped 20 pips lower from the 50 SMA and it is right at the 100 SMA. If the price slips 10 pips lower, we will have another winning trade in this pair after the sell signal in GBP/USD just hit take profit.
- Check out our free forex signals
- Follow the top economic events on FX Leaders economic calendar
- Trade better, discover more Forex Trading Strategies
- Open a FREE Trading Account


